INVITE-ONLY SCRIPT
Volume Delta (Expo)
█ Overview
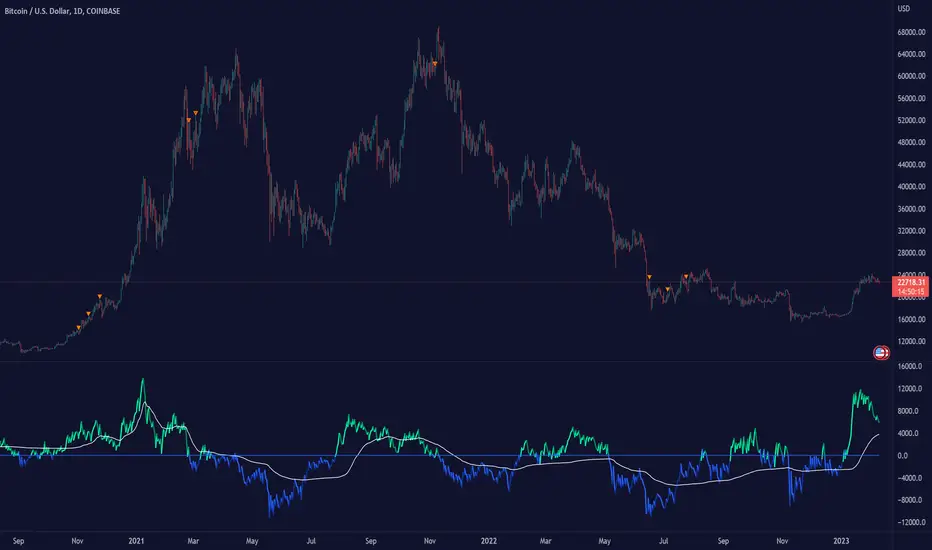
Volume Delta (Expo) is a trading tool that measures the difference between buying and selling volume in a given market. It is a powerful tool for analyzing volume clusters and price action, as it can help traders identify the direction and strength of the trend as well as potential volume-weighted support and resistance areas.
█ How is the Volume Delta calculated?
Volume Delta is calculated by subtracting the number of contracts traded on the bid from the number of contracts traded on the ask. A positive Volume Delta indicates that more contracts are being traded on the ask than on the bid, which suggests buying pressure. A negative Volume Delta indicates that more contracts are being traded on the bid than on the ask, which suggests selling pressure.
█ How to Use Volume Delta to Analyze Volume Clusters
Volume clusters are areas of high volume that indicate a potential change in price direction. Once the clusters have been identified, traders can then use Volume Delta to measure the difference between buying and selling volume in the clusters.
If the buying volume is greater than the selling volume, it indicates that the price is likely to move higher. Conversely, if the selling volume is greater than the buying volume, it indicates that the price is likely to move lower.
In addition to measuring the difference between buying and selling volume, traders can also use Volume Delta to analyze price action. By looking at the volume clusters and the corresponding price action, traders can identify potential support and resistance levels.
█ How to use
The volume delta provides insight into market sentiment, as a rise in buying volume on a positive close indicates that bullish sentiment is strengthening, while a rise in selling volume on a negative close indicates that bearish sentiment is increasing. In addition, use volume delta to identify the direction and strength of the trend.
Volume - divergences
If the volume delta is positive but the price trend is still bearish, it could be an indication that the current trend is weakening and a reversal may be imminent. Similarly, if the volume delta is negative but the price trend is still bullish, it could be an indication that the current trend is weakening and a reversal may be imminent.
█ Indicator Features
In addition to the main Volume Delta feature, the indicator has the following features:
-----------------
Disclaimer
The information contained in my Scripts/Indicators/Ideas/Algos/Systems does not constitute financial advice or a solicitation to buy or sell any securities of any type. I will not accept liability for any loss or damage, including without limitation any loss of profit, which may arise directly or indirectly from the use of or reliance on such information.
All investments involve risk, and the past performance of a security, industry, sector, market, financial product, trading strategy, backtest, or individual's trading does not guarantee future results or returns. Investors are fully responsible for any investment decisions they make. Such decisions should be based solely on an evaluation of their financial circumstances, investment objectives, risk tolerance, and liquidity needs.
My Scripts/Indicators/Ideas/Algos/Systems are only for educational purposes!
Volume Delta (Expo) is a trading tool that measures the difference between buying and selling volume in a given market. It is a powerful tool for analyzing volume clusters and price action, as it can help traders identify the direction and strength of the trend as well as potential volume-weighted support and resistance areas.
█ How is the Volume Delta calculated?
Volume Delta is calculated by subtracting the number of contracts traded on the bid from the number of contracts traded on the ask. A positive Volume Delta indicates that more contracts are being traded on the ask than on the bid, which suggests buying pressure. A negative Volume Delta indicates that more contracts are being traded on the bid than on the ask, which suggests selling pressure.
- Note, our Volume Delta (Expo) uses intrabar analysis in combination with volume clusters which is a great approximation to calculating volume delta on TradingView. The tool is equipped with a unique volume-weighted cluster function to calculate the delta trend over time as well as a dynamic trend strength calculation.
█ How to Use Volume Delta to Analyze Volume Clusters
Volume clusters are areas of high volume that indicate a potential change in price direction. Once the clusters have been identified, traders can then use Volume Delta to measure the difference between buying and selling volume in the clusters.
If the buying volume is greater than the selling volume, it indicates that the price is likely to move higher. Conversely, if the selling volume is greater than the buying volume, it indicates that the price is likely to move lower.
In addition to measuring the difference between buying and selling volume, traders can also use Volume Delta to analyze price action. By looking at the volume clusters and the corresponding price action, traders can identify potential support and resistance levels.
█ How to use
The volume delta provides insight into market sentiment, as a rise in buying volume on a positive close indicates that bullish sentiment is strengthening, while a rise in selling volume on a negative close indicates that bearish sentiment is increasing. In addition, use volume delta to identify the direction and strength of the trend.
- It's common among volume traders to use volume delta to confirm trends, identify reversals, divergences, and volume-weighted support and resistance areas
Volume - divergences
If the volume delta is positive but the price trend is still bearish, it could be an indication that the current trend is weakening and a reversal may be imminent. Similarly, if the volume delta is negative but the price trend is still bullish, it could be an indication that the current trend is weakening and a reversal may be imminent.
█ Indicator Features
In addition to the main Volume Delta feature, the indicator has the following features:
- Adaptive or Stability Volume Strength: Choose between adaptive or stability volume strength.
- Exhausted Volume bars: Show Exhausted Volume Bars on the chart.
- Divergences: Enable Regular and Hidden Volume Divergences
-----------------
Disclaimer
The information contained in my Scripts/Indicators/Ideas/Algos/Systems does not constitute financial advice or a solicitation to buy or sell any securities of any type. I will not accept liability for any loss or damage, including without limitation any loss of profit, which may arise directly or indirectly from the use of or reliance on such information.
All investments involve risk, and the past performance of a security, industry, sector, market, financial product, trading strategy, backtest, or individual's trading does not guarantee future results or returns. Investors are fully responsible for any investment decisions they make. Such decisions should be based solely on an evaluation of their financial circumstances, investment objectives, risk tolerance, and liquidity needs.
My Scripts/Indicators/Ideas/Algos/Systems are only for educational purposes!
僅限邀請腳本
只有經作者授權的使用者才能訪問此腳本,且通常需付費。您可以將此腳本加入收藏,但需先向作者申請並獲得許可後才能使用 — 點擊此處了解更多。如需更多詳情,請依照作者說明或直接聯繫Zeiierman。
除非您完全信任其作者並了解腳本的工作原理,否則TradingView不建議您付費或使用腳本。您也可以在我們的社群腳本中找到免費的開源替代方案。
作者的說明
Get instant access here: https://zeiiermantrading.com
提醒:在請求訪問權限之前,請閱讀僅限邀請腳本指南。
Access my indicators at: zeiierman.com/
Join Our Free Discord: discord.gg/zeiiermantrading
Join Our Free Discord: discord.gg/zeiiermantrading
免責聲明
這些資訊和出版物並不意味著也不構成TradingView提供或認可的金融、投資、交易或其他類型的意見或建議。請在使用條款閱讀更多資訊。