INVITE-ONLY SCRIPT
已更新 Optimal Moving Average (AI/ML) [wbburgin]
Some traders swear by the 200-period moving average. Others, by the 100-period. Others, the 14-period. It depends on your asset, your timeframe, the trend…
The fact of the matter is that no moving average will ever be a consistent indicator for a serious trader - a fixed-length moving average will always need confirmation indicators and tests. When your instrument is trending, you need a faster moving average to better fit the data; when your instrument is ranging, you need a slower moving average that cleans the data. This just is not possible given the way the moving average is traditionally coded, which makes it a lagging indicator.
Thus we need a moving average that:
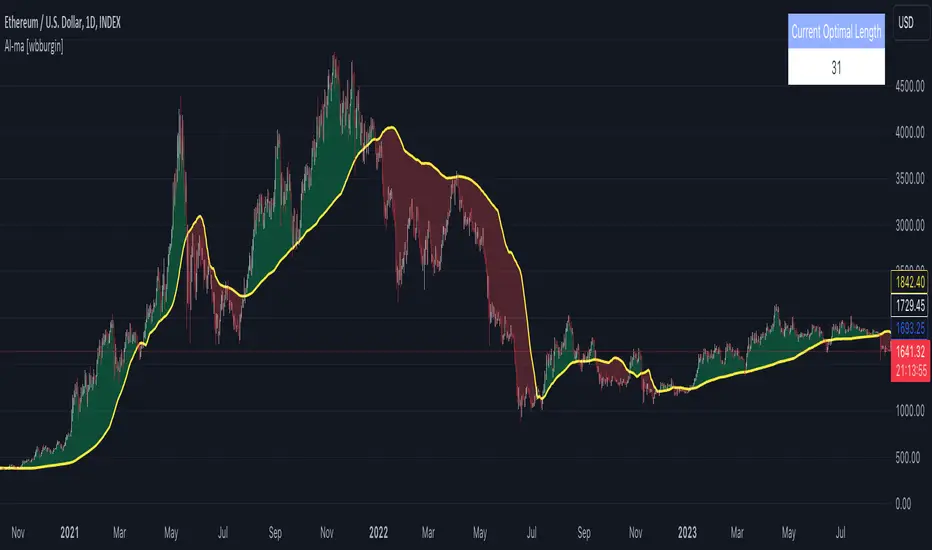
The Optimal Moving Average selects the optimal moving average length for a projected future price. The algorithm classifies moving averages by their effectiveness in predicting future price movement. If a moving average of length n has historically been accurate in predicting the next bar, the moving average will be tested compared to its peers (n-1, n+5, n-100, etc.) and promoted or demoted depending on its effectiveness. This means that the indicator will not have a length input like other static moving averages or machine-learning moving averages on TradingView- it will select the ideal length for your chart from the average that has the least error and best prediction.
Advantages over other ML Moving Averages on TradingView
The vast majority of AI/ML moving average algorithms classify their moving averages only by if the average is above or below the current price.
This approach is inherently flawed because the model
This indicator solves all those problems. It classifies moving averages by the scale of which their rate predicts the next price. Thus it is quick to catch trend changes but also acts as support or resistance, and models the projected price more accurately than a traditional moving average.
The fact of the matter is that no moving average will ever be a consistent indicator for a serious trader - a fixed-length moving average will always need confirmation indicators and tests. When your instrument is trending, you need a faster moving average to better fit the data; when your instrument is ranging, you need a slower moving average that cleans the data. This just is not possible given the way the moving average is traditionally coded, which makes it a lagging indicator.
Thus we need a moving average that:
- can project the next prices, and
- can change its length depending on what best fits these future prices.
The Optimal Moving Average selects the optimal moving average length for a projected future price. The algorithm classifies moving averages by their effectiveness in predicting future price movement. If a moving average of length n has historically been accurate in predicting the next bar, the moving average will be tested compared to its peers (n-1, n+5, n-100, etc.) and promoted or demoted depending on its effectiveness. This means that the indicator will not have a length input like other static moving averages or machine-learning moving averages on TradingView- it will select the ideal length for your chart from the average that has the least error and best prediction.
Advantages over other ML Moving Averages on TradingView
The vast majority of AI/ML moving average algorithms classify their moving averages only by if the average is above or below the current price.
This approach is inherently flawed because the model
- Is not predictive of future prices (the structural lagging problem still exists),
- Is not built on a variable-length MA (cannot select alternating lengths depending on the bar), and
- does not classify the scale of difference between the MA and the price.
This indicator solves all those problems. It classifies moving averages by the scale of which their rate predicts the next price. Thus it is quick to catch trend changes but also acts as support or resistance, and models the projected price more accurately than a traditional moving average.
發行說明
Added additional moving averages for maximum error and average error, which can help identify other resistance points in the MA map:FAQ: I am gradually phasing out my Patreon because of the time it takes to maintain.
BTC: 35PdMMMXFCvPjXKwn8wsRFNwMEPgStaKUJ
Test my strategies on CryptoRobotics: cryptorobotics.co/?trade=f23b09
BTC: 35PdMMMXFCvPjXKwn8wsRFNwMEPgStaKUJ
Test my strategies on CryptoRobotics: cryptorobotics.co/?trade=f23b09
免責聲明
這些資訊和出版物並非旨在提供,也不構成TradingView提供或認可的任何形式的財務、投資、交易或其他類型的建議或推薦。請閱讀使用條款以了解更多資訊。
FAQ: I am gradually phasing out my Patreon because of the time it takes to maintain.
BTC: 35PdMMMXFCvPjXKwn8wsRFNwMEPgStaKUJ
Test my strategies on CryptoRobotics: cryptorobotics.co/?trade=f23b09
BTC: 35PdMMMXFCvPjXKwn8wsRFNwMEPgStaKUJ
Test my strategies on CryptoRobotics: cryptorobotics.co/?trade=f23b09
免責聲明
這些資訊和出版物並非旨在提供,也不構成TradingView提供或認可的任何形式的財務、投資、交易或其他類型的建議或推薦。請閱讀使用條款以了解更多資訊。