OPEN-SOURCE SCRIPT
已更新 CBC Flip

This is an indicator for the Candle By Candle (CBC) Flip strategy as created by maplestax
It’s useful to traders because it’s a simple approach to gauge if bulls or bears are in control for any particular candle. The logic is as follows:
If the most recent candle close is above the previous candle high, then bulls are in control.
If the most recent candle close is below the previous candle low, then bears are in control.
If neither of these 2 conditions are met, then whoever was already in control remains in force until one of the 2 conditions is met and the sentiment is flipped, hence the name CBC Flip.
My script is original because there are no other CBC Flip scripts available on TV. This is the first, which is why I created it, to help other traders benefit from the power of CBC Flips.
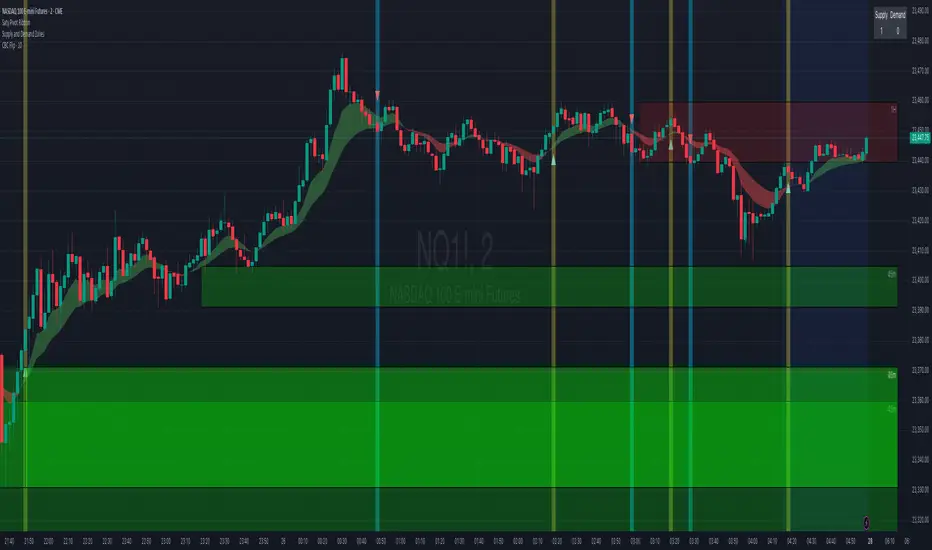
The indicator output is simply interpreted as follows:
Triangle up = bulls in control
Triangle down = bears in control
In my experience this script is best used on the 5 or 10 minute time frames, as it helps to keep you in the trade for the bigger moves once a trend is established, while not getting shaken out from the “noisy” up/down candle price action of lower time frames like the 1 minute.
I’ve also had more success with this indicator when only taking long trades once the green triangle appears and price is above VWAP, and only taking short trades once the red triangle appears and price is below VWAP.
發行說明
In the original version, a generic alert appeared when either the bulls or bears were in control. I've now created separate alerts, one alert for bulls, another for bears.發行說明
As per the updated chart above,When CBC flips long, suggested risk is candle low
When CBC flips short, suggested risk is candle high
發行說明
Removed the = in the <= >= to eliminate fake outs when it closes on the high or on the low of the previous candle. It needs to close above (not on) the high of the previous candle for longs, and close below (not on) the low of the previous candle for shorts. 發行說明
Added the option to now print the CBC flip on any time frame, rather than only printing the CBC flips on the current chart time frame. e.g if your chart is currently on the 2m TF but wanting to see the CBC flips that are happening on the 10m TF.Also added the option of background colour changes on the candles where the CBC flips occur.
發行說明
Based on feedback from several users where they said the size of the triangles is too big, I’ve now reduced their size to be small. Usage tips:
I trade on the 2m timeframe, but in the CBC Flip indicator settings, I choose the 10m timeframe, so that on the 2m chart it will show where the CBC has flipped on the 10m timeframe. This ensures I’m trading with the sentiment of the higher timeframe (stronger trend).
To increase probabilities, I also prefer to take longs coming out of demand zones and shorts out of supply zones, as these are where institutions have their buy and sell orders. Conversely, I’ll typically avoid taking longs into overhead supply, and shorts into demand below.
開源腳本
秉持TradingView一貫精神,這個腳本的創作者將其設為開源,以便交易者檢視並驗證其功能。向作者致敬!您可以免費使用此腳本,但請注意,重新發佈代碼需遵守我們的社群規範。
免責聲明
這些資訊和出版物並非旨在提供,也不構成TradingView提供或認可的任何形式的財務、投資、交易或其他類型的建議或推薦。請閱讀使用條款以了解更多資訊。
開源腳本
秉持TradingView一貫精神,這個腳本的創作者將其設為開源,以便交易者檢視並驗證其功能。向作者致敬!您可以免費使用此腳本,但請注意,重新發佈代碼需遵守我們的社群規範。
免責聲明
這些資訊和出版物並非旨在提供,也不構成TradingView提供或認可的任何形式的財務、投資、交易或其他類型的建議或推薦。請閱讀使用條款以了解更多資訊。