INVITE-ONLY SCRIPT
已更新 The Strat Patterns Indicator v1.0
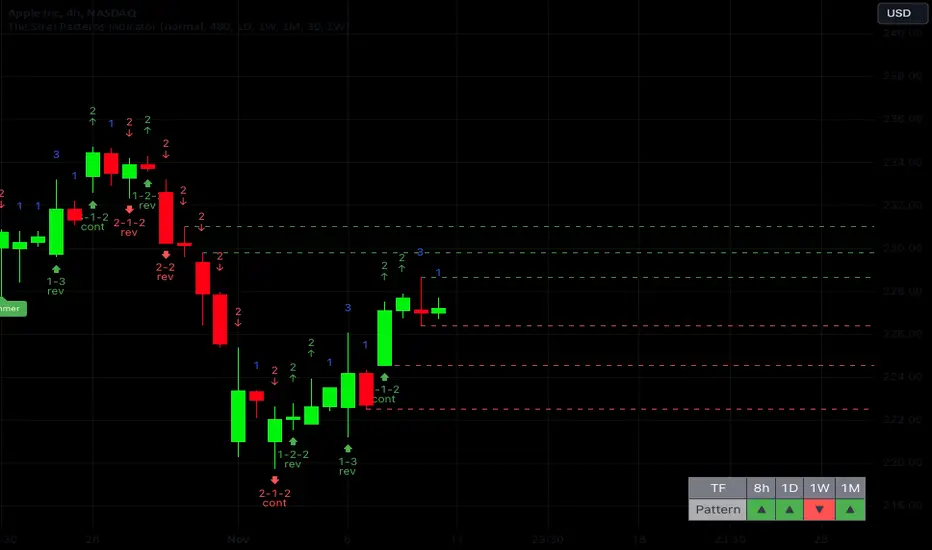
The Strat Patterns Indicator is a tool that draws Strat patterns in real-time, highlights Strat scenarios, key levels, and helps traders effectively apply the Strat trading strategy.
It combines features such as pattern recognition, timeframe continuity analysis, target level highlighting, and custom alerts to simplify trading decisions and maximize profit potential.
Display All Strat Patterns
The Strat Patterns Indicator shows all Strat patterns directly on your chart, making it easier to spot trading opportunities in real-time. You can choose to show or hide specific patterns based on your preferences. The patterns include:

Highlight Major Candlestick Patterns
The indicator highlights important candlestick formations that are crucial for forecasting the major trend reversals in the market. These candlestick patterns include:
By showcasing these patterns, the indicator helps traders quickly identify possible reversals or continuations, providing an extra layer of confirmation for trading decisions.

Timeframe Continuity Table
This indicator includes a customizable table that displays timeframe continuity, allowing you to align your trades with the overall market trend. You can select up to four higher timeframes to monitor, helping you ensure that your trades follow the broader trend direction.
This feature makes it easy to identify whether the market trend is aligned across multiple timeframes, enhancing your ability to make high-probability trades.

Show Target Levels (Previous Highs/Lows)
The indicator highlights target levels based on previous highs or lows, making it easier to set realistic profit targets and manage trades effectively.
By identifying these key levels, you can better gauge potential price movements and plan your trades with greater precision, ensuring that you maximize profit opportunities while minimizing risk.

Highlight Higher Timeframe Target Levels
This feature allows you to display target levels from a higher timeframe while trading on a lower timeframe.
For example, if you are trading on a 4-hour chart, you can choose to show daily target levels, including high/low levels and Fibonacci golden ratios. This helps you identify more significant profit targets and enhances your ability to capture larger moves while staying aligned with the overall trend.

Breakout Confirmation
The indicator provides an option to display the previous candlestick's high or low value, helping you confirm breakouts in Strat patterns. This feature is useful for validating whether a true breakout has occurred, giving you greater confidence in your trade entries and helping you avoid potential false breakouts.
Alerts for Strat Patterns
With this feature, you can set up alerts that trigger whenever a Strat pattern forms. This ensures you never miss a trading opportunity, keeping you informed and ready to act when key patterns emerge. The alerts provide real-time notifications, allowing you to stay on top of market movements without constantly monitoring your charts.
It combines features such as pattern recognition, timeframe continuity analysis, target level highlighting, and custom alerts to simplify trading decisions and maximize profit potential.
Display All Strat Patterns
The Strat Patterns Indicator shows all Strat patterns directly on your chart, making it easier to spot trading opportunities in real-time. You can choose to show or hide specific patterns based on your preferences. The patterns include:
- 2-2 Continuation
- 2-2 Reversal
- 3-2-2 Reversal
- 2-1-2 Continuation
- 2-1-2 Reversal
- 1-2-2 Reversal
- 3-1-2 Continuation
- 1-3 Reversal
- 3-1-2 Reversal
Highlight Major Candlestick Patterns
The indicator highlights important candlestick formations that are crucial for forecasting the major trend reversals in the market. These candlestick patterns include:
- Hammer
- Shooting Star
- Doji
- Gravestone Doji
- Dragonfly Doji
- Morning Doji Star
- Evening Doji Star
By showcasing these patterns, the indicator helps traders quickly identify possible reversals or continuations, providing an extra layer of confirmation for trading decisions.
Timeframe Continuity Table
This indicator includes a customizable table that displays timeframe continuity, allowing you to align your trades with the overall market trend. You can select up to four higher timeframes to monitor, helping you ensure that your trades follow the broader trend direction.
This feature makes it easy to identify whether the market trend is aligned across multiple timeframes, enhancing your ability to make high-probability trades.
Show Target Levels (Previous Highs/Lows)
The indicator highlights target levels based on previous highs or lows, making it easier to set realistic profit targets and manage trades effectively.
By identifying these key levels, you can better gauge potential price movements and plan your trades with greater precision, ensuring that you maximize profit opportunities while minimizing risk.
Highlight Higher Timeframe Target Levels
This feature allows you to display target levels from a higher timeframe while trading on a lower timeframe.
For example, if you are trading on a 4-hour chart, you can choose to show daily target levels, including high/low levels and Fibonacci golden ratios. This helps you identify more significant profit targets and enhances your ability to capture larger moves while staying aligned with the overall trend.
Breakout Confirmation
The indicator provides an option to display the previous candlestick's high or low value, helping you confirm breakouts in Strat patterns. This feature is useful for validating whether a true breakout has occurred, giving you greater confidence in your trade entries and helping you avoid potential false breakouts.
Alerts for Strat Patterns
With this feature, you can set up alerts that trigger whenever a Strat pattern forms. This ensures you never miss a trading opportunity, keeping you informed and ready to act when key patterns emerge. The alerts provide real-time notifications, allowing you to stay on top of market movements without constantly monitoring your charts.
發行說明
Updated Alerts Feature僅限邀請腳本
只有經作者授權的使用者才能訪問此腳本,且通常需付費。您可以將此腳本加入收藏,但需先向作者申請並獲得許可後才能使用 — 點擊此處了解更多。如需更多詳情,請依照作者說明或直接聯繫ForexBee。
除非您完全信任其作者並了解腳本的工作原理,否則TradingView不建議您付費或使用腳本。您也可以在我們的社群腳本中找到免費的開源替代方案。
作者的說明
📩 To request access to indicator, please send us a message or visit our website 🌐 https://forexbee.co/the-strat-patterns-indicator/ . We’ll be happy to assist you!
🚀 Thank you for your interest!
提醒:在請求訪問權限之前,請閱讀僅限邀請腳本指南。
ForexBee
免責聲明
這些資訊和出版物並不意味著也不構成TradingView提供或認可的金融、投資、交易或其他類型的意見或建議。請在使用條款閱讀更多資訊。
僅限邀請腳本
只有經作者授權的使用者才能訪問此腳本,且通常需付費。您可以將此腳本加入收藏,但需先向作者申請並獲得許可後才能使用 — 點擊此處了解更多。如需更多詳情,請依照作者說明或直接聯繫ForexBee。
除非您完全信任其作者並了解腳本的工作原理,否則TradingView不建議您付費或使用腳本。您也可以在我們的社群腳本中找到免費的開源替代方案。
作者的說明
📩 To request access to indicator, please send us a message or visit our website 🌐 https://forexbee.co/the-strat-patterns-indicator/ . We’ll be happy to assist you!
🚀 Thank you for your interest!
提醒:在請求訪問權限之前,請閱讀僅限邀請腳本指南。
ForexBee
免責聲明
這些資訊和出版物並不意味著也不構成TradingView提供或認可的金融、投資、交易或其他類型的意見或建議。請在使用條款閱讀更多資訊。