OPEN-SOURCE SCRIPT
TradeQUO Herrick Payoff RSI

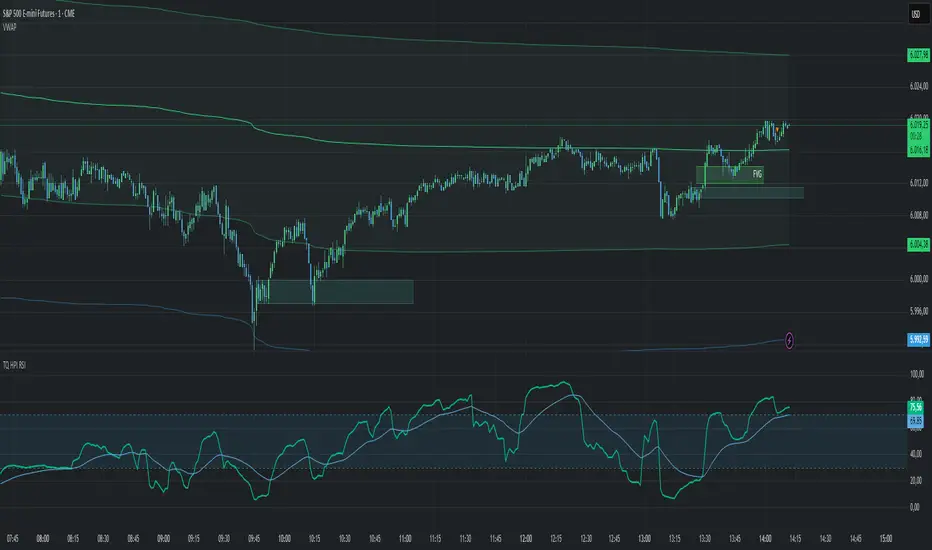
Herrick Payoff Index RSI (HPI-RSI) with Signal Line
An advanced oscillator that measures market strength not just by price, but by "smart money flow."
This indicator is not a typical RSI. Instead of applying the Relative Strength Index to price alone, it calculates it on the cumulative Herrick Payoff Index (HPI). This creates a unique oscillator that reflects the underlying sentiment and capital flow in the market.
What is the Herrick Payoff Index (HPI)?
The HPI is a classic sentiment indicator that combines three crucial elements to determine if money is flowing into or out of an asset:
By combining these factors, the HPI provides a more comprehensive picture of market strength than indicators based solely on price.
How This Indicator Works
The script follows a logical, multi-step process:
Interpretation and Application
You can use this indicator much like a standard RSI, but with the added context of money flow:
Settings
The indicator has been deliberately kept simple:
An advanced oscillator that measures market strength not just by price, but by "smart money flow."
This indicator is not a typical RSI. Instead of applying the Relative Strength Index to price alone, it calculates it on the cumulative Herrick Payoff Index (HPI). This creates a unique oscillator that reflects the underlying sentiment and capital flow in the market.
What is the Herrick Payoff Index (HPI)?
The HPI is a classic sentiment indicator that combines three crucial elements to determine if money is flowing into or out of an asset:
- Price Change: The direction and momentum of the market.
- Trading Volume: The conviction behind the price movement.
- Open Interest (OI): The total number of open contracts (mainly in futures), which indicates if new capital is entering the market.
By combining these factors, the HPI provides a more comprehensive picture of market strength than indicators based solely on price.
How This Indicator Works
The script follows a logical, multi-step process:
- It calculates the raw Herrick Payoff Index for each bar.
- It creates a cumulative sum of this index to generate a continuous money flow value.
- This cumulative value is smoothed with a short-period EMA to reduce noise.
- The RSI is then applied to this smoothed HPI value.
- An additional, configurable signal line (moving average) is added to facilitate trading signals.
Interpretation and Application
You can use this indicator much like a standard RSI, but with the added context of money flow:
- Overbought/Oversold: Values above 70 suggest an overbought condition, while values below 30 signal an oversold condition.
- Signal Line Crossovers: A cross of the HPI-RSI line above the signal line can be seen as a bullish signal. A cross below can be seen as a bearish signal.
- Divergences: Look for divergences between the indicator and the price. A bullish divergence (price makes a lower low, indicator makes a higher low) can indicate an upcoming move to the upside. A bearish divergence (price makes a higher high, indicator makes a lower high) can signal a potential move to the downside.
Settings
The indicator has been deliberately kept simple:
- HPI Smoothing Length: Smoothing length (1-5) for the cumulative HPI.
- RSI Length: The lookback period for the RSI calculation.
- Signal Line Settings: Here you can enable/disable the signal line and customize its type and length.
- Display Settings: Adjust the colors of the RSI and signal lines to your preference.
This indicator is a tool for analysis and should always be used in combination with other methods and a solid risk management strategy. Happy trading!
開源腳本
秉持TradingView一貫精神,這個腳本的創作者將其設為開源,以便交易者檢視並驗證其功能。向作者致敬!您可以免費使用此腳本,但請注意,重新發佈代碼需遵守我們的社群規範。
免責聲明
這些資訊和出版物並非旨在提供,也不構成TradingView提供或認可的任何形式的財務、投資、交易或其他類型的建議或推薦。請閱讀使用條款以了解更多資訊。
開源腳本
秉持TradingView一貫精神,這個腳本的創作者將其設為開源,以便交易者檢視並驗證其功能。向作者致敬!您可以免費使用此腳本,但請注意,重新發佈代碼需遵守我們的社群規範。
免責聲明
這些資訊和出版物並非旨在提供,也不構成TradingView提供或認可的任何形式的財務、投資、交易或其他類型的建議或推薦。請閱讀使用條款以了解更多資訊。