OPEN-SOURCE SCRIPT
AlgoPilotX – FibFusion Confluence PRO

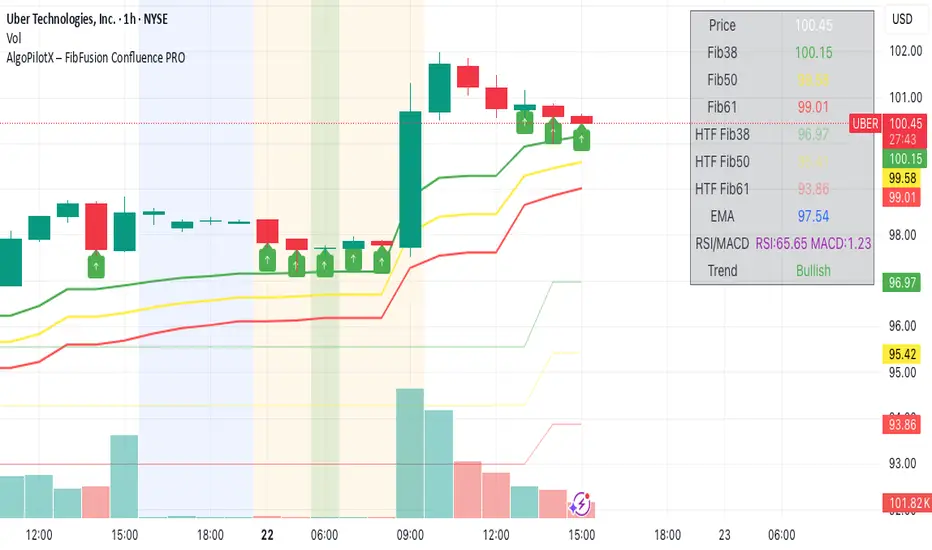
Take your Fibonacci trading to the next level with AlgoPilotX – FibFusion Confluence PRO. This advanced TradingView indicator combines multi-timeframe Fibonacci retracements with key technical indicators to identify high-probability trading zones.
Features:
Detects TF and Higher Timeframe (HTF) Fibonacci levels automatically.
Highlights Fib confluence zones with background colors for bullish and bearish probabilities.
Displays arrows on exact Fib touches for quick visual cues.
Integrated EMA, RSI, and MACD analysis to improve trend accuracy.
Dynamic Trend Indicator: Bullish, Bearish, or Neutral.
Interactive dashboard showing all key levels and indicators in real-time with intuitive color coding.
Supports multiple chart timeframes and recalculates trend and confluence dynamically.
Alerts for high probability bullish or bearish zones, ready to integrate into your trading strategy.
How to Use:
Observe price approaching Fibonacci levels displayed as lines and arrows.
Confluence Zones:
Green background: High-probability bullish zone.
Red background: High-probability bearish zone.
Neutral: No strong confluence.
Confirm signals using EMA, RSI, and MACD.
Use the dashboard to track all key levels, multi-timeframe Fibs, and current Trend.
Enter trades near high-probability confluence zones and manage risk accordingly.
Perfect for swing traders, day traders, and anyone using Fibonacci retracements to find precise entry and exit points.
開源腳本
本著TradingView的真正精神,此腳本的創建者將其開源,以便交易者可以查看和驗證其功能。向作者致敬!雖然您可以免費使用它,但請記住,重新發佈程式碼必須遵守我們的網站規則。
免責聲明
這些資訊和出版物並不意味著也不構成TradingView提供或認可的金融、投資、交易或其他類型的意見或建議。請在使用條款閱讀更多資訊。
開源腳本
本著TradingView的真正精神,此腳本的創建者將其開源,以便交易者可以查看和驗證其功能。向作者致敬!雖然您可以免費使用它,但請記住,重新發佈程式碼必須遵守我們的網站規則。
免責聲明
這些資訊和出版物並不意味著也不構成TradingView提供或認可的金融、投資、交易或其他類型的意見或建議。請在使用條款閱讀更多資訊。