OPEN-SOURCE SCRIPT
Day Range with OHLC Labels
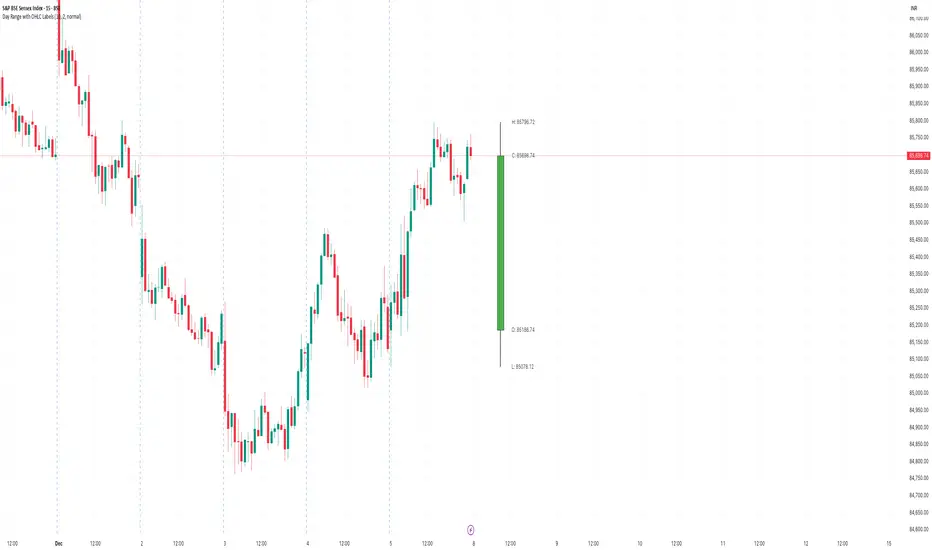
This indicator creates a synthetic daily candlestick that appears to the right of the chart, visually separated from real price bars.
It helps traders quickly view each day’s High, Low, Open, and Close without zooming, scrolling, or switching to higher timeframes.
What This Tool Does
✔ Draws a floating daily candle to the right of the current chart
✔ Displays the true Daily Open, High, Low, and Close
✔ Shows a center-aligned wick representing the full high-low range
✔ Shows a box-style candle body positioned using real OHLC values
✔ Labels the values (O, H, L, C) with large, clear fonts
✔ Automatically updates at each new day
✔ Works on any timeframe
✔ Helps intraday traders track daily structure visually
Why This Indicator Is Useful
This script is ideal for intraday traders who want instant awareness of the current day’s range.
Instead of guessing or drawing manual lines, you get a clean daily candlestick rendered off to the right side, avoiding chart clutter.
Great for:
Customization
Adjustable offset: position the candle further right
Configurable colors for wick + body
Large-font labels for easy reading
Automatically clears and redraws cleanly each day
Summary
This tool creates a clear, minimalistic, right-side daily candlestick complete with OHLC labels and centralized wick.
It’s designed to improve chart clarity and support quick decision-making without blocking price candles.
It helps traders quickly view each day’s High, Low, Open, and Close without zooming, scrolling, or switching to higher timeframes.
What This Tool Does
✔ Draws a floating daily candle to the right of the current chart
✔ Displays the true Daily Open, High, Low, and Close
✔ Shows a center-aligned wick representing the full high-low range
✔ Shows a box-style candle body positioned using real OHLC values
✔ Labels the values (O, H, L, C) with large, clear fonts
✔ Automatically updates at each new day
✔ Works on any timeframe
✔ Helps intraday traders track daily structure visually
Why This Indicator Is Useful
This script is ideal for intraday traders who want instant awareness of the current day’s range.
Instead of guessing or drawing manual lines, you get a clean daily candlestick rendered off to the right side, avoiding chart clutter.
Great for:
- Range traders
- Breakout traders
- Liquidity zone analysis
- High/Low reference tracking
- Traders who prefer non-intrusive visuals
Customization
Adjustable offset: position the candle further right
Configurable colors for wick + body
Large-font labels for easy reading
Automatically clears and redraws cleanly each day
Summary
This tool creates a clear, minimalistic, right-side daily candlestick complete with OHLC labels and centralized wick.
It’s designed to improve chart clarity and support quick decision-making without blocking price candles.
開源腳本
秉持TradingView一貫精神,這個腳本的創作者將其設為開源,以便交易者檢視並驗證其功能。向作者致敬!您可以免費使用此腳本,但請注意,重新發佈代碼需遵守我們的社群規範。
免責聲明
這些資訊和出版物並非旨在提供,也不構成TradingView提供或認可的任何形式的財務、投資、交易或其他類型的建議或推薦。請閱讀使用條款以了解更多資訊。
開源腳本
秉持TradingView一貫精神,這個腳本的創作者將其設為開源,以便交易者檢視並驗證其功能。向作者致敬!您可以免費使用此腳本,但請注意,重新發佈代碼需遵守我們的社群規範。
免責聲明
這些資訊和出版物並非旨在提供,也不構成TradingView提供或認可的任何形式的財務、投資、交易或其他類型的建議或推薦。請閱讀使用條款以了解更多資訊。