OPEN-SOURCE SCRIPT
EM Yield Curve Index
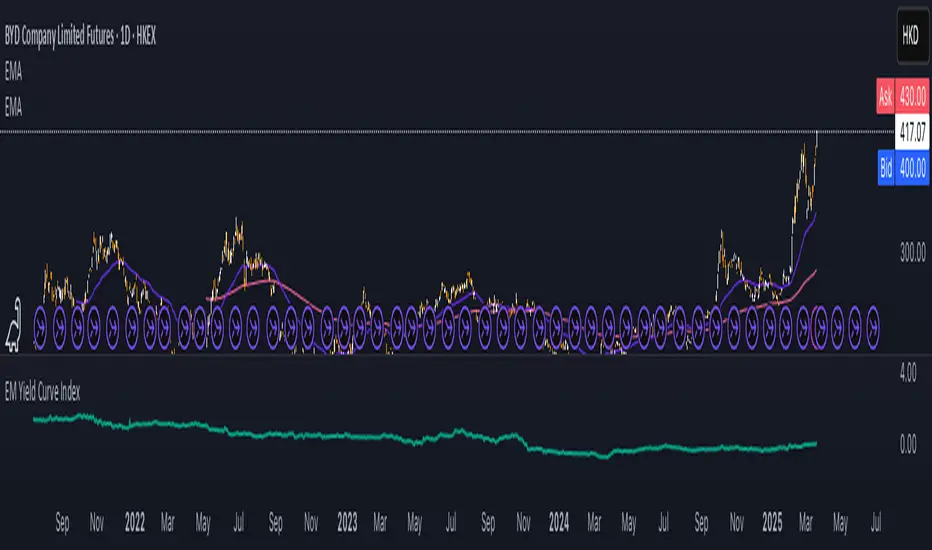
This script calculates the Emerging Markets (EM) Yield Curve Index by aggregating the 2-year and 10-year bond yields of major emerging economies. The bond yields are weighted based on each country's bond market size, with data sourced from TradingView. The yield curve is derived by subtracting the 2-year yield from the 10-year yield, providing insights into economic conditions, risk sentiment, and potential recessions in emerging markets. The resulting EM Yield Curve Index is plotted for visualization.
Note: In some cases, TradingView's TVC data did not provide a 2-year bond yield. When this occurred, the best available alternative yield (such as 3-month, 1-year or 4-year yields) was used to approximate the short-term interest rate for that country.
Note: In some cases, TradingView's TVC data did not provide a 2-year bond yield. When this occurred, the best available alternative yield (such as 3-month, 1-year or 4-year yields) was used to approximate the short-term interest rate for that country.
開源腳本
秉持TradingView一貫精神,這個腳本的創作者將其設為開源,以便交易者檢視並驗證其功能。向作者致敬!您可以免費使用此腳本,但請注意,重新發佈代碼需遵守我們的社群規範。
免責聲明
這些資訊和出版物並非旨在提供,也不構成TradingView提供或認可的任何形式的財務、投資、交易或其他類型的建議或推薦。請閱讀使用條款以了解更多資訊。
開源腳本
秉持TradingView一貫精神,這個腳本的創作者將其設為開源,以便交易者檢視並驗證其功能。向作者致敬!您可以免費使用此腳本,但請注意,重新發佈代碼需遵守我們的社群規範。
免責聲明
這些資訊和出版物並非旨在提供,也不構成TradingView提供或認可的任何形式的財務、投資、交易或其他類型的建議或推薦。請閱讀使用條款以了解更多資訊。