OPEN-SOURCE SCRIPT
BTC Volatility Forecast
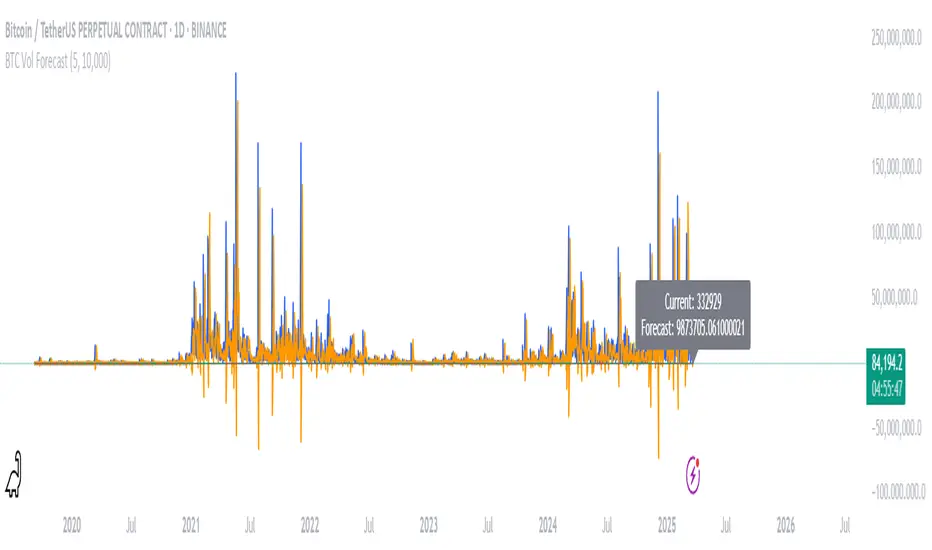
The "BTC Volatility Forecast" indicator is designed to help traders anticipate Bitcoin (BTC) price volatility by analyzing historical daily price ranges and projecting future fluctuations. Inspired by advanced volatility forecasting studies, it calculates an approximate realized variance using the squared difference between each day’s high and low prices. By applying a simple linear regression model over the past five days of variance data (customizable via the "Lag Period" input), the indicator provides a forecast for the next day’s volatility. This makes it a valuable tool for BTC traders looking to gauge potential market turbulence and adjust their strategies accordingly.
On the chart, the indicator displays two lines: a blue solid line representing the current realized variance and an orange line showing the forecasted volatility for the upcoming day. Traders can set a "Volatility Threshold" to trigger alerts when the forecast exceeds a specified level, aiding in risk management or trade planning. A debug label on the last bar also shows the exact current and forecasted values for quick reference. While this version uses daily data for simplicity, it captures the essence of volatility prediction and can be a starting point for understanding BTC market dynamics—perfect for both novice and experienced traders on TradingView.
On the chart, the indicator displays two lines: a blue solid line representing the current realized variance and an orange line showing the forecasted volatility for the upcoming day. Traders can set a "Volatility Threshold" to trigger alerts when the forecast exceeds a specified level, aiding in risk management or trade planning. A debug label on the last bar also shows the exact current and forecasted values for quick reference. While this version uses daily data for simplicity, it captures the essence of volatility prediction and can be a starting point for understanding BTC market dynamics—perfect for both novice and experienced traders on TradingView.
開源腳本
秉持TradingView一貫精神,這個腳本的創作者將其設為開源,以便交易者檢視並驗證其功能。向作者致敬!您可以免費使用此腳本,但請注意,重新發佈代碼需遵守我們的社群規範。
免責聲明
這些資訊和出版物並非旨在提供,也不構成TradingView提供或認可的任何形式的財務、投資、交易或其他類型的建議或推薦。請閱讀使用條款以了解更多資訊。
免責聲明
這些資訊和出版物並非旨在提供,也不構成TradingView提供或認可的任何形式的財務、投資、交易或其他類型的建議或推薦。請閱讀使用條款以了解更多資訊。