OPEN-SOURCE SCRIPT
已更新 Smash + Proba + BF
This script is designed to automatically display various levels that can be useful for trading.
These levels must be entered in the script as parameters in the form of lists separated by semicolons (";").
There are three groups of levels:

These levels must be entered in the script as parameters in the form of lists separated by semicolons (";").
There are three groups of levels:
- Smash: Levels provided in the Smashelito newsletter
- Proba: Probability levels (50% and 70%) of reaching certain price points, calculated using options data
- BF: Option-related levels provided by Krechendo Connect / BlackFlag
Example :
發行說明
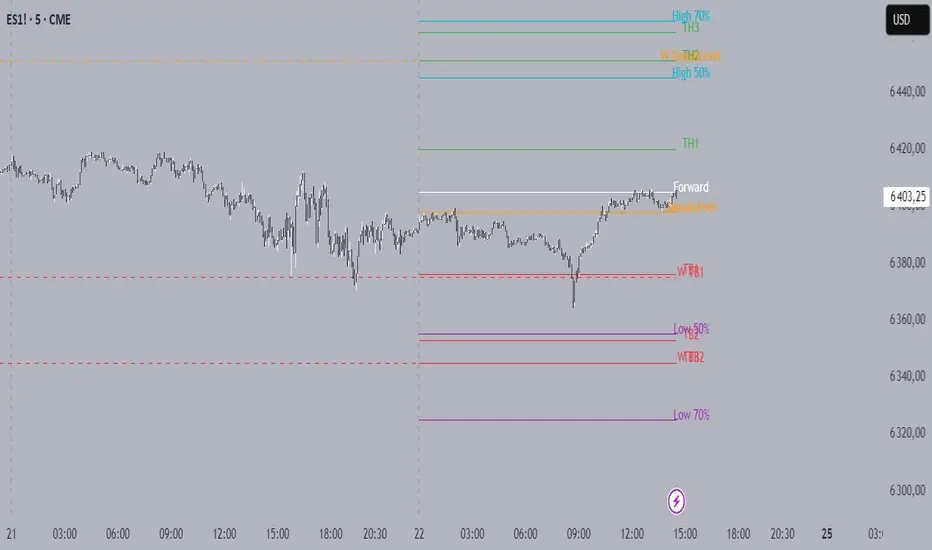
A comprehensive multi-timeframe support and resistance indicator that displays key trading levels across daily and weekly timeframes.Features
Daily Levels (Solid Lines)
Smash Level: Key breakout/breakdown level (Orange)
Target High 1-3 (TH1-TH3): Upside targets (Green)
Target Low 1-3 (TB1-TB3): Downside targets (Red)
Weekly Levels (Dashed Lines)
Same structure as daily levels but displayed across the entire current week
Semi-transparent styling for clear distinction from daily levels
Probability Levels
High 70%/50%: Upper probability zones (Aqua)
Low 50%/70%: Lower probability zones (Purple)
Book Flow (BF) Levels
Call Resistance: Key call option resistance levels (Lime)
Put Support: Key put option support levels (Red)
Dominant Buy/Sell: Order flow dominance levels (Green/Red)
HVL (High Volume Levels): Both regular and 0DTE versions (Blue)
1D Min/Max: Daily range extremes (Yellow)
Gamma Wall: Critical gamma hedging levels (Aqua)
Input Format
Enter levels separated by semicolons (;) in the format: Level1;Level2;Level3;etc.
Usage
Perfect for traders who need to track multiple support/resistance levels across different timeframes and market dynamics. The indicator automatically updates and extends lines as new bars form, providing real-time level tracking with clear visual differentiation between daily and weekly levels.
發行說明
# Smash + Proba + BF Levels IndicatorA comprehensive multi-timeframe support and resistance indicator that displays key trading levels across daily and weekly timeframes.
## Features
### Daily Levels (Solid Lines)
- **Smash Level**: Key breakout/breakdown level (Orange)
- **Target High 1-3 (TH1-TH3)**: Upside targets (Green)
- **Target Low 1-3 (TB1-TB3)**: Downside targets (Red)
### Weekly Levels (Dashed Lines)
- Same structure as daily levels but displayed across the entire current week
- Semi-transparent styling for clear distinction from daily levels
### Probability Levels
- **High 70%/50%**: Upper probability zones (Aqua)
- **Low 50%/70%**: Lower probability zones (Purple)
### Book Flow (BF) Levels
- **Call Resistance**: Key call option resistance levels (Lime)
- **Put Support**: Key put option support levels (Red)
- **Dominant Buy/Sell**: Order flow dominance levels (Green/Red)
- **HVL (High Volume Levels)**: Both regular and 0DTE versions (Blue)
- **1D Min/Max**: Daily range extremes (Yellow)
- **Gamma Wall**: Critical gamma hedging levels (Aqua)
## Input Format
Enter levels separated by semicolons (;) in the format: `Level1;Level2;Level3;etc.`
## Usage
Perfect for traders who need to track multiple support/resistance levels across different timeframes and market dynamics. The indicator automatically updates and extends lines as new bars form, providing real-time level tracking with clear visual differentiation between daily and weekly levels.
開源腳本
秉持TradingView一貫精神,這個腳本的創作者將其設為開源,以便交易者檢視並驗證其功能。向作者致敬!您可以免費使用此腳本,但請注意,重新發佈代碼需遵守我們的社群規範。
免責聲明
這些資訊和出版物並非旨在提供,也不構成TradingView提供或認可的任何形式的財務、投資、交易或其他類型的建議或推薦。請閱讀使用條款以了解更多資訊。
免責聲明
這些資訊和出版物並非旨在提供,也不構成TradingView提供或認可的任何形式的財務、投資、交易或其他類型的建議或推薦。請閱讀使用條款以了解更多資訊。