OPEN-SOURCE SCRIPT
Marketcap
Definition
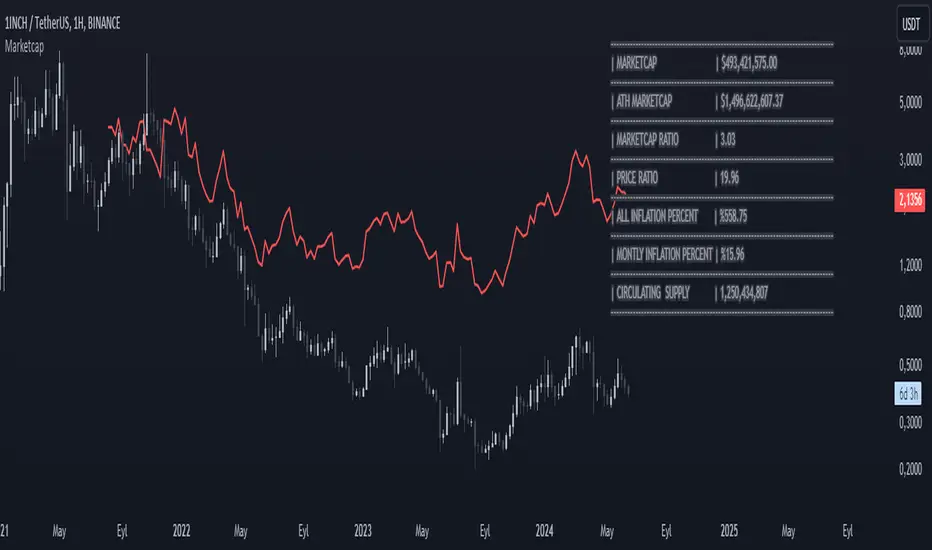
This indicator was designed to reveal the relationship between the price of the product and its market value. The red average marketcap line that appears on the chart is the line. And the further up this line moves from the chart, the more it shows that there is a mismatch between the price and the market value. So what does this incompatibility mean? There are purchases of the product, but since the supply of the product into circulation is constantly increasing, it means that these purchases are not reflected in the price, which means there is inflation.
The main purpose of our indicator is to calculate inflation of the product. It is the understanding of whether or not the amount of supply put into circulation in response to the investment is reflected in the product price while increasing the market value.
Attention: Transactions are made based on the data received via CRYPTOCAP. In cases where this data cannot be received, the "UNSUPPORTED SOURCE" warning is displayed. You can use Settings to change the source from which data can be retrieved.
Labels
The labels are explained one by one below.
MARKETCAP: Shows the current market value.
ATH MARKETCAP: Shows the highest market value of all time.
MARKETCAP RATIO: It gives the ratio between the highest level and the lowest level of the market value.
PRICE RATIO: Gives the ratio between the highest level and the lowest level of the crypto price.
ALL INFLATION PERCENT: It refers to the percentage of all inflation that has developed so far. It is also the percentage difference between market value and price.
MONTHLY INFLATION PERCENT: It refers to the monthly estimated inflation percentage.
CIRCULATING SUPPLY: It refers to the estimated circulation supply of the product.
Best Use
It should bring to mind the idea that the further the indicator curve moves away from the price, the higher the inflation will be. In order for a product to reach its previous peak, its market value must normally increase by the "MARKETCAP RATIO" value and the "PRICE RATIO" value. This should make you think that this product needs more investment to reach its former peak. And it is necessary to be careful when purchasing such products.
Disclaimer
This indicator is for informational purposes only and should be used for educational purposes only. You may lose money if you rely on this to trade without additional information. Use at your own risk.
Version
v1.0
開源腳本
秉持TradingView一貫精神,這個腳本的創作者將其設為開源,以便交易者檢視並驗證其功能。向作者致敬!您可以免費使用此腳本,但請注意,重新發佈代碼需遵守我們的社群規範。
免責聲明
這些資訊和出版物並非旨在提供,也不構成TradingView提供或認可的任何形式的財務、投資、交易或其他類型的建議或推薦。請閱讀使用條款以了解更多資訊。
開源腳本
秉持TradingView一貫精神,這個腳本的創作者將其設為開源,以便交易者檢視並驗證其功能。向作者致敬!您可以免費使用此腳本,但請注意,重新發佈代碼需遵守我們的社群規範。
免責聲明
這些資訊和出版物並非旨在提供,也不構成TradingView提供或認可的任何形式的財務、投資、交易或其他類型的建議或推薦。請閱讀使用條款以了解更多資訊。