OPEN-SOURCE SCRIPT
Market Health Oscillator
Designed to provide traders with a comprehensive view of the overall health of a market. By combining the rate of change of key indicators, the MHO offers insight into potential shifts in market sentiment.
Components:
Price Rate of Change: The MHO considers the rate of change of the price of an asset over a specified period. This element reflects the momentum of the asset's price movement, aiding in the assessment of potential trend shifts.
Volume Rate of Change: Tracking the rate of change of trading volume provides insights into market participation and interest. Changes in volume can signify shifts in market sentiment and potential trend reversals.
Volatility Rate of Change: The rate of change of volatility, often measured using the Average True Range (ATR), helps gauge the level of uncertainty in the market. An increase in volatility can indicate heightened market activity and potential reversals.
Advance-Decline Line: The MHO takes into account the Advance-Decline Line, which compares the number of advancing stocks to declining stocks. This component offers insights into market breadth and the underlying strength of the current trend.
Calculation and Interpretation:
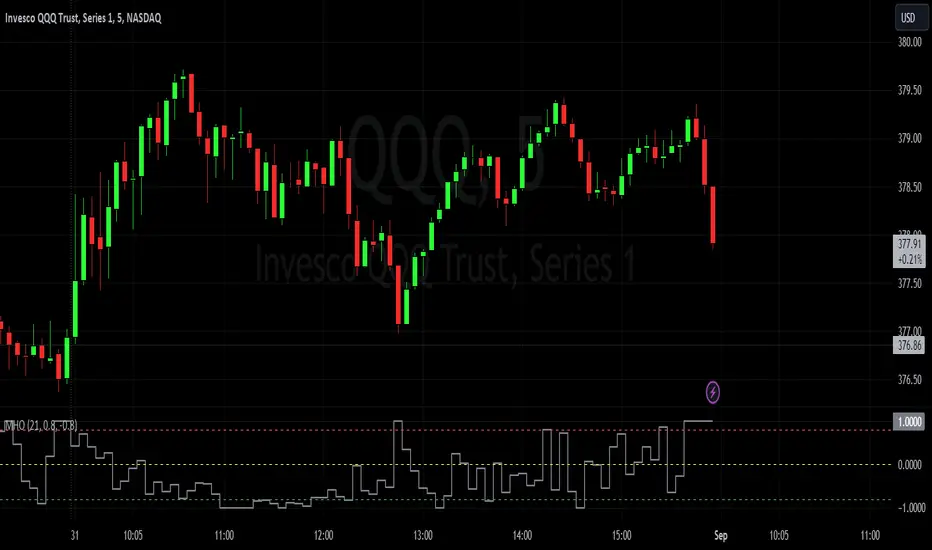
The MHO aggregates the rate of change of these components and combines them to provide a single oscillator reading. This reading is then normalized to a range between -1 and 1. Positive values suggest bullish market health, while negative values indicate bearish conditions. The oscillator's extremes, coupled with divergence patterns, can signal potential market turning points.
Application:
Identify potential trend reversals or corrections by watching for extreme MHO readings.
Assess the overall health of a market by observing the general direction and amplitude of the oscillator.
Look for divergences between price and the MHO for insights into potential shifts in market sentiment.
This was inspired to offer a holistic perspective on market dynamics. By encompassing price, volume, volatility, and breadth factors, the MHO assists in a comprehensive assessment of market health.
Components:
Price Rate of Change: The MHO considers the rate of change of the price of an asset over a specified period. This element reflects the momentum of the asset's price movement, aiding in the assessment of potential trend shifts.
Volume Rate of Change: Tracking the rate of change of trading volume provides insights into market participation and interest. Changes in volume can signify shifts in market sentiment and potential trend reversals.
Volatility Rate of Change: The rate of change of volatility, often measured using the Average True Range (ATR), helps gauge the level of uncertainty in the market. An increase in volatility can indicate heightened market activity and potential reversals.
Advance-Decline Line: The MHO takes into account the Advance-Decline Line, which compares the number of advancing stocks to declining stocks. This component offers insights into market breadth and the underlying strength of the current trend.
Calculation and Interpretation:
The MHO aggregates the rate of change of these components and combines them to provide a single oscillator reading. This reading is then normalized to a range between -1 and 1. Positive values suggest bullish market health, while negative values indicate bearish conditions. The oscillator's extremes, coupled with divergence patterns, can signal potential market turning points.
Application:
Identify potential trend reversals or corrections by watching for extreme MHO readings.
Assess the overall health of a market by observing the general direction and amplitude of the oscillator.
Look for divergences between price and the MHO for insights into potential shifts in market sentiment.
This was inspired to offer a holistic perspective on market dynamics. By encompassing price, volume, volatility, and breadth factors, the MHO assists in a comprehensive assessment of market health.
開源腳本
秉持TradingView一貫精神,這個腳本的創作者將其設為開源,以便交易者檢視並驗證其功能。向作者致敬!您可以免費使用此腳本,但請注意,重新發佈代碼需遵守我們的社群規範。
KP
免責聲明
這些資訊和出版物並非旨在提供,也不構成TradingView提供或認可的任何形式的財務、投資、交易或其他類型的建議或推薦。請閱讀使用條款以了解更多資訊。
免責聲明
這些資訊和出版物並非旨在提供,也不構成TradingView提供或認可的任何形式的財務、投資、交易或其他類型的建議或推薦。請閱讀使用條款以了解更多資訊。