OPEN-SOURCE SCRIPT
Jenkins Square Root Levels
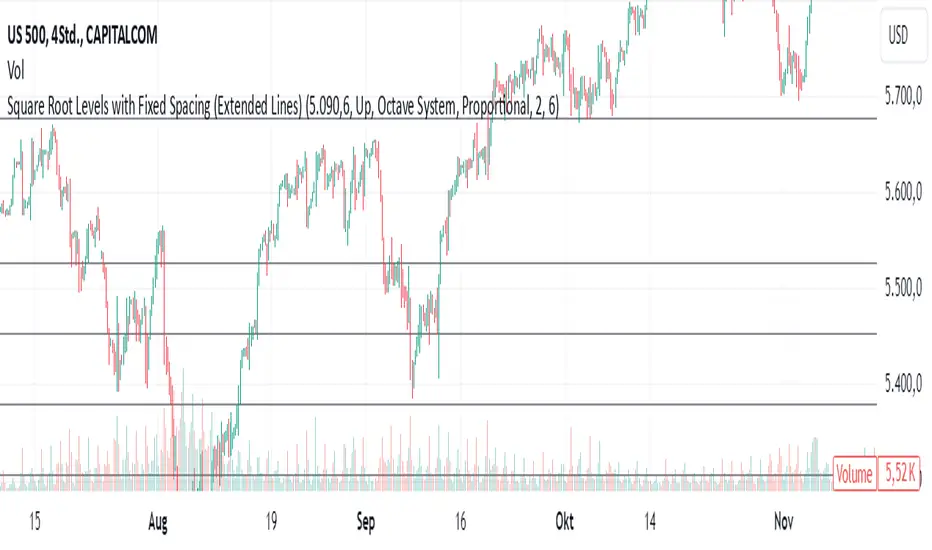
Square Root Levels with Fixed Spacing (Extended Lines)
This script calculates and displays horizontal levels based on the square root of a price point. It offers two calculation modes, Octave System and Square Root Multiples, allowing traders to identify key support and resistance levels derived from price harmonics.
The methodology is inspired by the teachings of Michael Jenkins, to whom I owe much gratitude for sharing his profound insights into the geometric principles of trading.
Features and Functions
1. Calculation Modes
Octave System:
Divides the square root range into specified steps, called "octave divisions."
Each division calculates levels proportionally or evenly spaced, depending on the selected spacing mode.
Multiple repetitions (or multiples) extend these levels upward, downward, or both.
Square Root Multiples:
Adds or subtracts multiples of the square root of the price point to create levels.
These multiples act as harmonics of the original square root, providing meaningful levels for price action.
2. Spacing Modes
Proportional: Levels are scaled proportionally with each multiple, resulting in increasing spacing as multiples grow.
Even: Levels are spaced equally, maintaining a consistent distance regardless of the multiple.
3. Direction
Up: Calculates levels above the price point only.
Down: Calculates levels below the price point only.
Both: Displays levels on both sides of the price point.
4. Customization Options
Price Point: Enter any key high, low, or other significant price point to anchor the calculations.
Octave Division: Adjust the number of divisions within the octave (e.g., 4 for quarter-steps, 8 for eighth-steps).
Number of Multiples: Set how far the levels should extend (e.g., 3 for 3 repetitions of the octave or square root multiples).
5. Visualization
The calculated levels are plotted as horizontal lines that extend across the chart.
Lines are sorted and plotted dynamically for clarity, with spacing adjusted according to the chosen parameters.
Acknowledgments
This script is based on the trading methodologies and geometric insights shared by Michael S. Jenkins. His work has profoundly influenced my understanding of price action and the role of harmonics in trading. Thank you, Michael Jenkins, for your invaluable teachings.
開源腳本
秉持TradingView一貫精神,這個腳本的創作者將其設為開源,以便交易者檢視並驗證其功能。向作者致敬!您可以免費使用此腳本,但請注意,重新發佈代碼需遵守我們的社群規範。
免責聲明
這些資訊和出版物並非旨在提供,也不構成TradingView提供或認可的任何形式的財務、投資、交易或其他類型的建議或推薦。請閱讀使用條款以了解更多資訊。
免責聲明
這些資訊和出版物並非旨在提供,也不構成TradingView提供或認可的任何形式的財務、投資、交易或其他類型的建議或推薦。請閱讀使用條款以了解更多資訊。