OPEN-SOURCE SCRIPT
NSDT MA High-Low
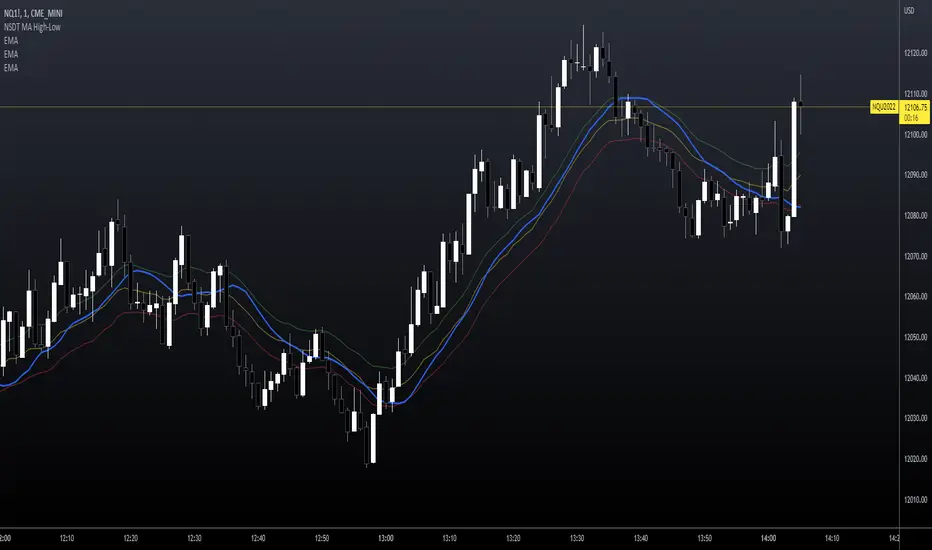
This may seem like a pretty basic Moving Average indicator but I haven't seen one that changes the calculation point depending if the market is going up or down.
I've added three EMA's (length of 20) on this sample chart to demonstrate the differences. These are not included with the indicator.
Green, EMA calculated on High
Red, EMA calculated on Low
Yellow, EMA calculated on Close (default)
Blue, EMA calculated on HIGH when rising but on LOW when falling. (looks at 3 candles back to gauge direction)
* * * Note you can choose between 5 different Moving Average types
Notice how the Blue line (when going up it's calculated on the High) is catching up to the Green line (which is already calculated on the High)?
Notice how the Blue line (when going down so it's calculated on the Low) is catching up to the Red line (which is already calculated on the Low)?
This gives a faster response in the direction of the market because it switches between calculating on the High or Low based on market direction.
This script is free and open source.
開源腳本
秉持TradingView一貫精神,這個腳本的創作者將其設為開源,以便交易者檢視並驗證其功能。向作者致敬!您可以免費使用此腳本,但請注意,重新發佈代碼需遵守我們的社群規範。
ALL indicators, strategies and bots are included with Discord access.
NorthStarDayTrading.com/discord
youtube.com/shorts/fWFQE7uEHvU
NorthStarDayTrading.com/discord
youtube.com/shorts/fWFQE7uEHvU
免責聲明
這些資訊和出版物並非旨在提供,也不構成TradingView提供或認可的任何形式的財務、投資、交易或其他類型的建議或推薦。請閱讀使用條款以了解更多資訊。