OPEN-SOURCE SCRIPT
Dynamic Support and Resistance -AYNET
Explanation of the Code
Lookback Period:
The lookback input defines how many candles to consider when calculating the support (lowest low) and resistance (highest high).
Support and Resistance Calculation:
ta.highest(high, lookback) identifies the highest high over the last lookback candles.
ta.lowest(low, lookback) identifies the lowest low over the same period.
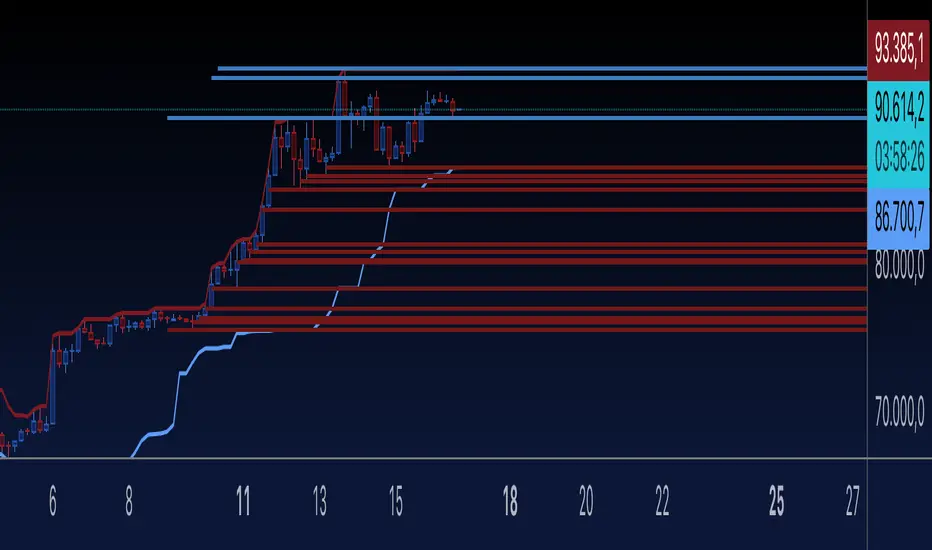
Dynamic Lines:
The line.new function creates yellow horizontal lines at the calculated support and resistance levels, extending them to the right.
Optional Plot:
plot is used to display the support and resistance levels as lines for visual clarity.
Customization:
You can adjust the lookback period and toggle the visibility of the lines via inputs.
How to Use This Code
Open the Pine Script Editor in TradingView.
Paste the above code into the editor.
Adjust the "Lookback Period for High/Low" to customize how the levels are calculated.
Enable or disable the support and resistance lines as needed.
This will create a chart similar to the one you provided, with horizontal yellow lines dynamically indicating the support and resistance levels. Let me know if you'd like any additional features or customizations!
Lookback Period:
The lookback input defines how many candles to consider when calculating the support (lowest low) and resistance (highest high).
Support and Resistance Calculation:
ta.highest(high, lookback) identifies the highest high over the last lookback candles.
ta.lowest(low, lookback) identifies the lowest low over the same period.
Dynamic Lines:
The line.new function creates yellow horizontal lines at the calculated support and resistance levels, extending them to the right.
Optional Plot:
plot is used to display the support and resistance levels as lines for visual clarity.
Customization:
You can adjust the lookback period and toggle the visibility of the lines via inputs.
How to Use This Code
Open the Pine Script Editor in TradingView.
Paste the above code into the editor.
Adjust the "Lookback Period for High/Low" to customize how the levels are calculated.
Enable or disable the support and resistance lines as needed.
This will create a chart similar to the one you provided, with horizontal yellow lines dynamically indicating the support and resistance levels. Let me know if you'd like any additional features or customizations!
開源腳本
秉持TradingView一貫精神,這個腳本的創作者將其設為開源,以便交易者檢視並驗證其功能。向作者致敬!您可以免費使用此腳本,但請注意,重新發佈代碼需遵守我們的社群規範。
免責聲明
這些資訊和出版物並非旨在提供,也不構成TradingView提供或認可的任何形式的財務、投資、交易或其他類型的建議或推薦。請閱讀使用條款以了解更多資訊。
開源腳本
秉持TradingView一貫精神,這個腳本的創作者將其設為開源,以便交易者檢視並驗證其功能。向作者致敬!您可以免費使用此腳本,但請注意,重新發佈代碼需遵守我們的社群規範。
免責聲明
這些資訊和出版物並非旨在提供,也不構成TradingView提供或認可的任何形式的財務、投資、交易或其他類型的建議或推薦。請閱讀使用條款以了解更多資訊。