OPEN-SOURCE SCRIPT
Jarass regression lines
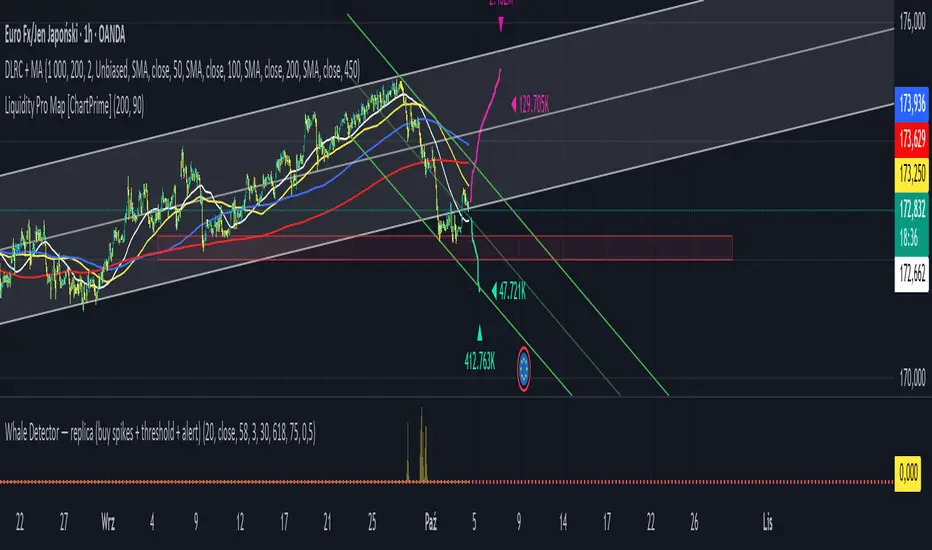
Double Linear Regression Ultimate + MA Ribbon (DLRC + MA)
The DLRC + MA indicator is an advanced technical analysis tool that combines double linear regression channels with a moving average ribbon (MA Ribbon). Designed for traders who want to simultaneously track trend, volatility, and potential support/resistance levels.
Key Features:
1. Double Linear Regression Channels:
• Inner Channel – shorter period, more sensitive to recent price movements.
• Outer Channel – longer period, reflects the long-term trend.
• Both channels display upper and lower boundaries and a midline.
• Optional logarithmic scale for price adjustment.
• Real-time R² values to assess regression accuracy.
2. MA Ribbon:
• Up to 4 different moving averages simultaneously.
• Supports SMA, EMA, SMMA (RMA), WMA, VWMA.
• Each MA can be individually enabled/disabled, with customizable period, source, and color.
• Helps identify trend direction and dynamic support/resistance levels.
3. Visualization:
• Channels are filled with semi-transparent colors for clarity.
• Midline for quick trend direction assessment.
• Label displays R² values of the channels in real time.
4. Suitable For:
• Short-term and long-term traders seeking a combination of linear regression analysis and classic trend-following tools.
• Useful for identifying overbought/oversold zones and potential trend reversal points.
Summary:
DLRC + MA combines statistical precision of linear regression with intuitive trend visualization via a MA ribbon. It provides quick insight into market direction, volatility, and potential turning points, all in one chart overlay.
開源腳本
秉持TradingView一貫精神,這個腳本的創作者將其設為開源,以便交易者檢視並驗證其功能。向作者致敬!您可以免費使用此腳本,但請注意,重新發佈代碼需遵守我們的社群規範。
免責聲明
這些資訊和出版物並非旨在提供,也不構成TradingView提供或認可的任何形式的財務、投資、交易或其他類型的建議或推薦。請閱讀使用條款以了解更多資訊。
開源腳本
秉持TradingView一貫精神,這個腳本的創作者將其設為開源,以便交易者檢視並驗證其功能。向作者致敬!您可以免費使用此腳本,但請注意,重新發佈代碼需遵守我們的社群規範。
免責聲明
這些資訊和出版物並非旨在提供,也不構成TradingView提供或認可的任何形式的財務、投資、交易或其他類型的建議或推薦。請閱讀使用條款以了解更多資訊。