INVITE-ONLY SCRIPT
Gamma Bands v. 7.0
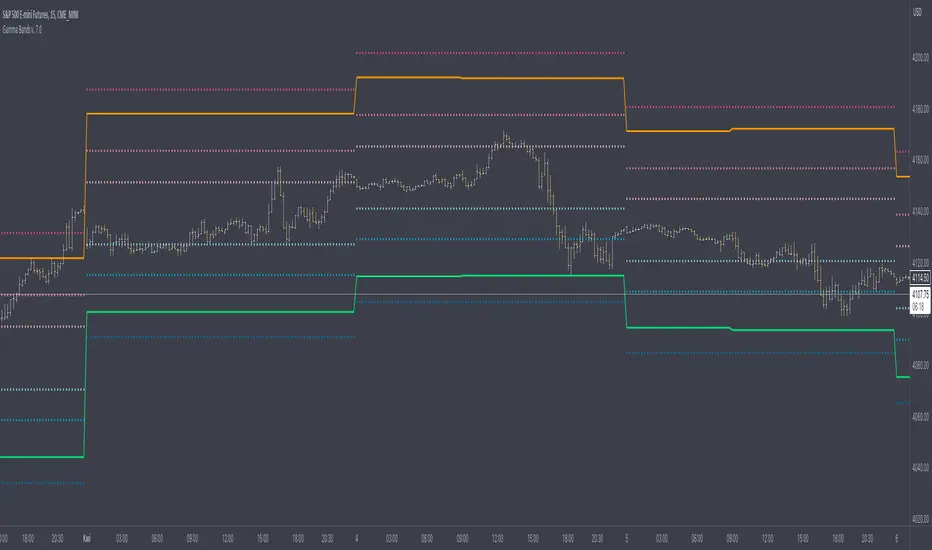
Gamma Bands are based on previous day data of base intrument, Volatility , Options flow (imported from external source Quandl via TradingView API as TV is not supporting Options as instruments) and few other additional factors to calculate intraday levels. Those levels in correlation with even pure Price Action works like a charm what is confirmed by big orders often placed exactly on those levels on Futures Contracts. We have levels +/- 0.25, 0.5 and 1.0 that are calculated from Pivot Point and are working like Support and Resistance. Higher the number of Gamma, stronger the level. Passing Gamma +1/-1 would be good entry point for trades as almost everytime it is equal to Trend Day. Levels are calculated by Machine Learning algorithm written in Python which downloads data from Options and Darkpool markets, process and calculate levels, export to Quandl and then in PineScript I import the data to indicator. Levels are refreshed each day and are valid for particular trading day.
There's possibility also to enable display of Initial Balance range (High and Low range of bars/candles from 1st hour of regular cash session). Breaking one of extremes of Initial Balance is very often driving sentiment for rest of the session.
Volatility Reversal Levels
They're calculated taking into account Options flow imported to TV (Strikes, Call/Put types & Expiration dates) in combination with Volatility, Volume flow. Based on that we calculate on daily basis Significant Close level and "Stop and Reversal level".
Very often reaching area close to those levels either trigger immediate reversal of previous trend or at least push price into consolidation range.
僅限邀請腳本
只有經作者授權的使用者才能訪問此腳本,且通常需付費。您可以將此腳本加入收藏,但需先向作者申請並獲得許可後才能使用 — 點擊此處了解更多。如需更多詳情,請依照作者說明或直接聯繫skyline-trader。
除非您完全信任其作者並了解腳本的工作原理,否則TradingView不建議您付費或使用腳本。您也可以在我們的社群腳本中找到免費的開源替代方案。
作者的說明
You can purchase subscription via website https://investsmarter.info where you also will find tutorials and market strategy videos.
提醒:在請求訪問權限之前,請閱讀僅限邀請腳本指南。
免責聲明
這些資訊和出版物並不意味著也不構成TradingView提供或認可的金融、投資、交易或其他類型的意見或建議。請在使用條款閱讀更多資訊。