OPEN-SOURCE SCRIPT
Realized Volatility (StdDev of Returns, %)
Realized Volatility (StdDev of Returns, %)
This indicator measures realized (historical) volatility by calculating the standard deviation of log returns over a user-defined lookback period. It helps traders and analysts observe how much the price has varied in the past, expressed as a percentage.
How it works:
Provides three volatility measures:
Inputs:
Notes:
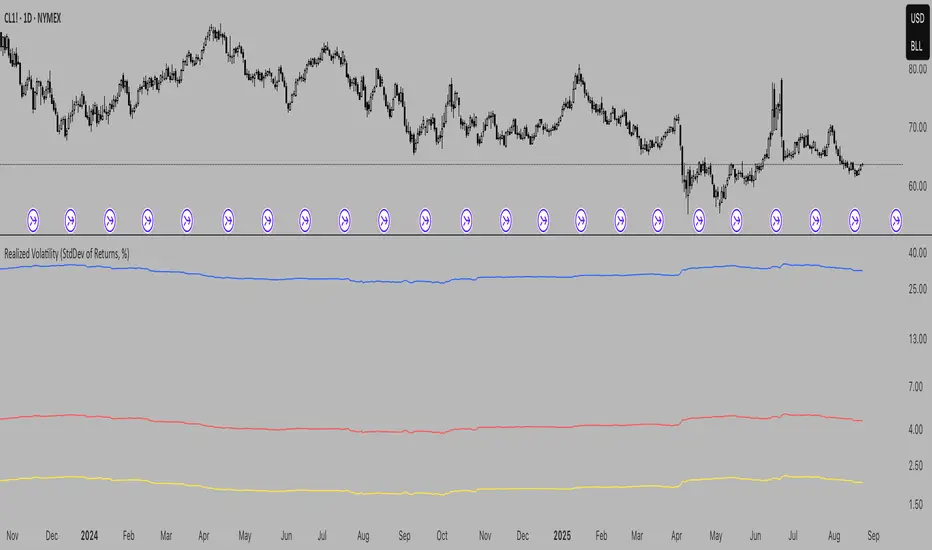
This indicator measures realized (historical) volatility by calculating the standard deviation of log returns over a user-defined lookback period. It helps traders and analysts observe how much the price has varied in the past, expressed as a percentage.
How it works:
- Computes close-to-close logarithmic returns.
- Calculates the standard deviation of these returns over the selected lookback window.
Provides three volatility measures:
- Daily Volatility (%): Standard deviation over the chosen period.
- Annualized Volatility (%): Scaled using the square root of the number of trading days per year (default = 250).
- Horizon Volatility (%): Scaled to a custom horizon (default = 5 days, useful for short-term views).
Inputs:
- Lookback Period: Number of bars used for volatility calculation.
- Trading Days per Year: Used for annualizing volatility.
- Horizon (days): Adjusts volatility to a shorter or longer time frame.
Notes:
- This is a statistical measure of past volatility, not a forecasting tool.
- If you change the scale to logarithmic, the indicator readibility improves.
- It should be used for analysis in combination with other tools and not as a standalone signal.
開源腳本
秉持TradingView一貫精神,這個腳本的創作者將其設為開源,以便交易者檢視並驗證其功能。向作者致敬!您可以免費使用此腳本,但請注意,重新發佈代碼需遵守我們的社群規範。
免責聲明
這些資訊和出版物並非旨在提供,也不構成TradingView提供或認可的任何形式的財務、投資、交易或其他類型的建議或推薦。請閱讀使用條款以了解更多資訊。
開源腳本
秉持TradingView一貫精神,這個腳本的創作者將其設為開源,以便交易者檢視並驗證其功能。向作者致敬!您可以免費使用此腳本,但請注意,重新發佈代碼需遵守我們的社群規範。
免責聲明
這些資訊和出版物並非旨在提供,也不構成TradingView提供或認可的任何形式的財務、投資、交易或其他類型的建議或推薦。請閱讀使用條款以了解更多資訊。