OPEN-SOURCE SCRIPT
已更新 Juice Levels
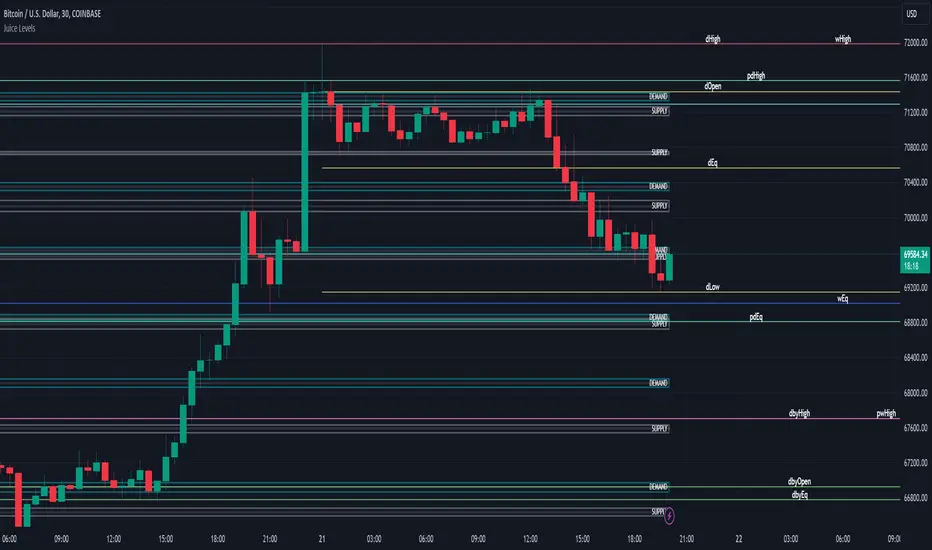
Supply and Demand Key Levels
These levels encompass key price points derived from various timeframes, providing crucial insights into market dynamics and potential trading opportunities. These levels include daily, prior day, day before yesterday, weekly, prior weekly, monthly, and prior monthly levels.
Daily, Prior Day, Day Before Yesterday Levels
Offer intraday reference points and historical context for analyzing short-term price movements.
Weekly, Prior Weekly Levels
Provide insights into longer-term trends and potential areas of price consolidation or breakout over a one-week timeframe.
Monthly, Prior Monthly Levels
Offer significant insights into macroeconomic trends and investor sentiment over longer timeframes, spanning one month.
Equilibrium Levels
Indicate points where supply and demand are relatively balanced, often serving as pivot points for price movements.
Supply and Demand Zones
Highlight areas on a price chart where significant buying or selling pressure is expected, aiding traders in identifying potential reversal or breakout zones.
These levels and zones are essential tools for traders to analyze market sentiment, identify support and resistance levels, and make informed trading decisions across various timeframes.
發行說明
- Added options to enable / disable every line per period開源腳本
秉持TradingView一貫精神,這個腳本的創作者將其設為開源,以便交易者檢視並驗證其功能。向作者致敬!您可以免費使用此腳本,但請注意,重新發佈代碼需遵守我們的社群規範。
- Juice Signals™
免責聲明
這些資訊和出版物並非旨在提供,也不構成TradingView提供或認可的任何形式的財務、投資、交易或其他類型的建議或推薦。請閱讀使用條款以了解更多資訊。
開源腳本
秉持TradingView一貫精神,這個腳本的創作者將其設為開源,以便交易者檢視並驗證其功能。向作者致敬!您可以免費使用此腳本,但請注意,重新發佈代碼需遵守我們的社群規範。
- Juice Signals™
免責聲明
這些資訊和出版物並非旨在提供,也不構成TradingView提供或認可的任何形式的財務、投資、交易或其他類型的建議或推薦。請閱讀使用條款以了解更多資訊。