OPEN-SOURCE SCRIPT
已更新 COT Commercials Positions Table
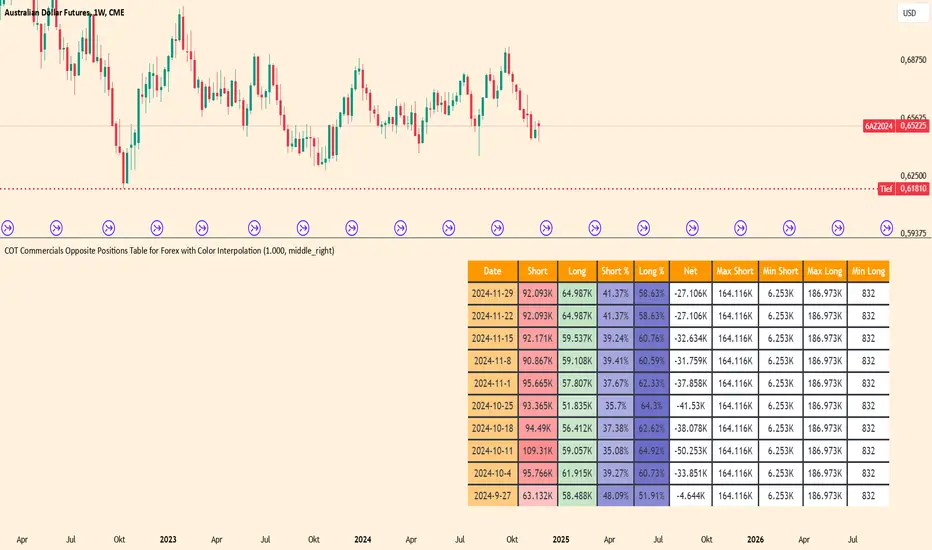
Der COT Commercials Opposite Positions Table for Forex ist ein umfangreicher TradingView-Indikator, der die Positionen der kommerziellen Marktteilnehmer (Commercials) im Rahmen des Commitments of Traders (COT)-Berichts darstellt. Er zeigt Long-, Short-, und Netto-Positionen sowie deren prozentuale Anteile für ausgewählte Märkte an.
Hauptmerkmale:
Datenquellenwahl: Unterstützt "Futures Only" und "Futures and Options".
Marktabdeckung: Umfasst Währungen, Rohstoffe, Indizes und Kryptowährungen.
Farbkodierung: Dynamische Farbverläufe zur Hervorhebung von Extremen bei Long-/Short-Positionen und Prozentsätzen.
Historische Daten: Zeigt Positionsdaten der letzten 10 Wochen an.
Anpassbare Tabelle: Klar strukturiert mit wichtigen Kennzahlen wie max./min. Positionen und Netto-Positionen.
Der Indikator ist besonders für Trader nützlich, die Marktstimmungen analysieren und Positionierungen großer Marktteilnehmer in ihre Handelsentscheidungen einbeziehen möchten.
Der Indikator ist hauptsächlich für Futures gedacht und funktioniert nur im 1 Woche Chart.
發行說明
The COT Commercials Opposite Positions Table for Forex is a comprehensive TradingView indicator that represents the positions of the commercial market participants (Commercials) as part of the Commitments of Traders (COT) report. It shows long, short, and net positions as well as their percentages for selected markets.Features:
Data Source Choice: Supports Futures Only and Futures and Options.
Market coverage: Includes currencies, commodities, indices, and cryptocurrencies.
Color coding: Dynamic gradients to highlight extremes in long/short positions and percentages.
Historical data: Displays position data from the last 10 weeks.
Customizable table: Clearly structured with important key figures such as max./min. positions and net positions.
The indicator is especially useful for traders who want to analyze market sentiments and include the positioning of large market participants in their trading decisions.
The indicator is mainly intended for futures and only works on the 1-week chart.
發行說明
Bug Fix. The Date ist now Friday when the data gets released.發行說明
new cot code發行說明
bug Fix開源腳本
秉持TradingView一貫精神,這個腳本的創作者將其設為開源,以便交易者檢視並驗證其功能。向作者致敬!您可以免費使用此腳本,但請注意,重新發佈代碼需遵守我們的社群規範。
免責聲明
這些資訊和出版物並非旨在提供,也不構成TradingView提供或認可的任何形式的財務、投資、交易或其他類型的建議或推薦。請閱讀使用條款以了解更多資訊。
免責聲明
這些資訊和出版物並非旨在提供,也不構成TradingView提供或認可的任何形式的財務、投資、交易或其他類型的建議或推薦。請閱讀使用條款以了解更多資訊。