OPEN-SOURCE SCRIPT
Ceres Trader NYSE Tick Indicator With Threshold Alerts
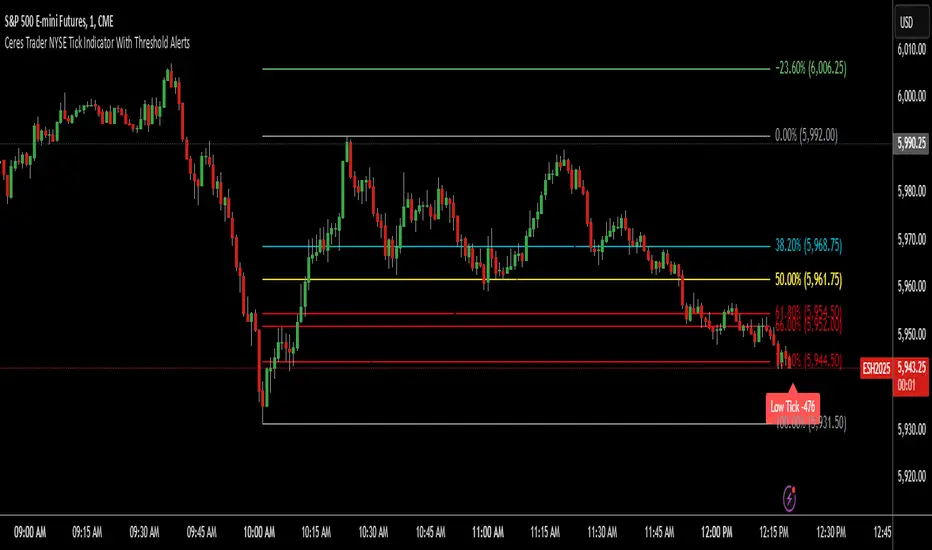
The Ceres Trader NYSE Tick Indicator provides real-time alerts for significant shifts in the NYSE Tick, empowering traders to identify potential overbought and oversold market conditions. It displays labels directly on the chart when the Tick reaches predefined thresholds, offering a clear and immediate visual representation of market sentiment.
Key Features:
Threshold-Based Alerts:
Highlights "High Tick" and "Low Tick" conditions when the Tick exceeds user-defined thresholds (default: 400 and -400).
Identifies "Extreme High Tick" and "Extreme Low Tick" conditions for more significant shifts (adjusted default: 800 and -800).
Visual Labels:
Displays colored labels directly on the price chart, indicating the type of Tick event and its value.
Green labels signal potential overbought conditions, while red labels indicate potential oversold conditions.
Low tick labels are placed below the price bar, and high tick labels are placed above the price bar for improved visibility.
Real-Time Data:
Utilizes the NYSE Tick symbol ("TICK") to provide up-to-the-minute market data.
User-Friendly Design:
Simple and intuitive design, suitable for traders of all experience levels.
How to Use:
Add the "Ceres Trader NYSE Tick Indicator with Threshold Alerts" to your TradingView chart.
Observe the colored labels that appear when the Tick reaches the specified thresholds.
Use these alerts to identify potential trading opportunities based on overbought or oversold market conditions.
Consider adjusting the threshold values within the indicator settings to align with your specific trading strategy.
開源腳本
秉持TradingView一貫精神,這個腳本的創作者將其設為開源,以便交易者檢視並驗證其功能。向作者致敬!您可以免費使用此腳本,但請注意,重新發佈代碼需遵守我們的社群規範。
Message Me to Join My Private, Premium Telegram Signals Channel. Also available for private coaching and trading sessions. t.me/CeresTraderSignals
免責聲明
這些資訊和出版物並非旨在提供,也不構成TradingView提供或認可的任何形式的財務、投資、交易或其他類型的建議或推薦。請閱讀使用條款以了解更多資訊。