OPEN-SOURCE SCRIPT
M2 Money Shift for Bitcoin [SAKANE]
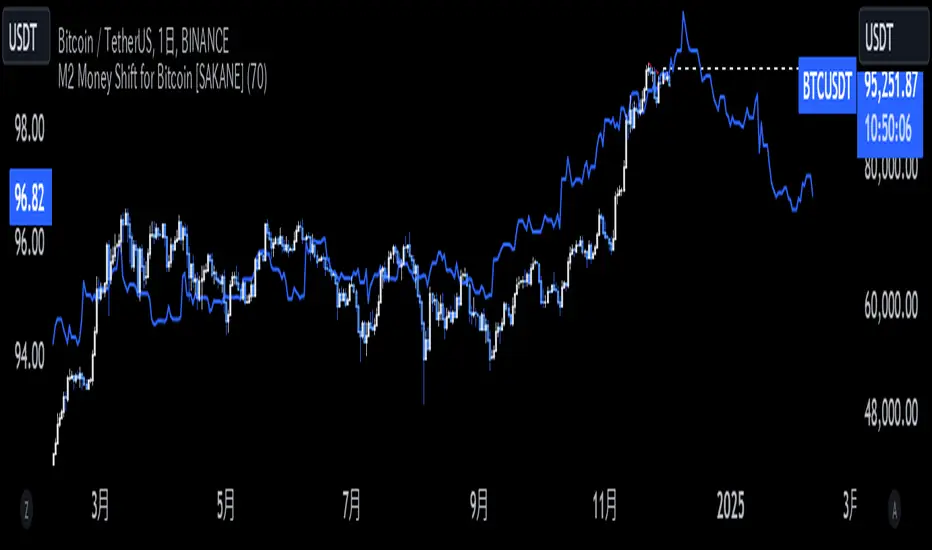
M2 Money Shift for Bitcoin was developed to visualize the impact of M2 Money, a macroeconomic indicator, on the Bitcoin market and to support trade analysis.
Bitcoin price fluctuations have a certain correlation with cycles in M2 money supply.In particular, it has been noted that changes in M2 supply can affect the bitcoin price 70 days in advance.Very high correlations have been observed in recent years in particular, making it useful as a supplemental analytical tool for trading.
Support for M2 data from multiple countries
M2 supply data from the U.S., Europe, China, Japan, the U.K., Canada, Australia, and India are integrated and all are displayed in U.S. dollar equivalents.
Slide function
Using the "Slide Days Forward" setting, M2 data can be slid up to 500 days, allowing for flexible analysis that takes into account the time difference from the bitcoin price.
Plotting Total Liquidity
Plot total liquidity (in trillions of dollars) by summing the M2 supply of multiple countries.
How to use
After applying the indicator to the chart, activate the M2 data for the required country from the settings screen. 2.
2. adjust "Slide Days Forward" to analyze the relationship between changes in M2 supply and bitcoin price
3. refer to the Gross Liquidity plot to build a trading strategy that takes into account macroeconomic influences.
Notes.
This indicator is an auxiliary tool for trade analysis and does not guarantee future price trends.
The relationship between M2 supply and bitcoin price depends on many factors and should be used in conjunction with other analysis methods.
開源腳本
秉持TradingView一貫精神,這個腳本的創作者將其設為開源,以便交易者檢視並驗證其功能。向作者致敬!您可以免費使用此腳本,但請注意,重新發佈代碼需遵守我們的社群規範。
免責聲明
這些資訊和出版物並非旨在提供,也不構成TradingView提供或認可的任何形式的財務、投資、交易或其他類型的建議或推薦。請閱讀使用條款以了解更多資訊。
開源腳本
秉持TradingView一貫精神,這個腳本的創作者將其設為開源,以便交易者檢視並驗證其功能。向作者致敬!您可以免費使用此腳本,但請注意,重新發佈代碼需遵守我們的社群規範。
免責聲明
這些資訊和出版物並非旨在提供,也不構成TradingView提供或認可的任何形式的財務、投資、交易或其他類型的建議或推薦。請閱讀使用條款以了解更多資訊。