OPEN-SOURCE SCRIPT
已更新 Technical checklist
No one indicator is perfect. People always have their favorite indicators and maintain a bias on weighing them purely on psychological reasons other than mathematical. This technical checklist indicator collected 20 common indicators and custom ones to address the issue of a bias weighted decision.
Here, I apply machine learning using a simple sigmoid neuron network with one hidden layer and a single node to avoid artifacts. For the ease of data collection, the indicator matrix is first shown as a heatmap. Once an uptrend signal window is selected manually, an indicator matrix can be recorded in a binary format (i.e., 1 0 0 1 1 0, etc.).
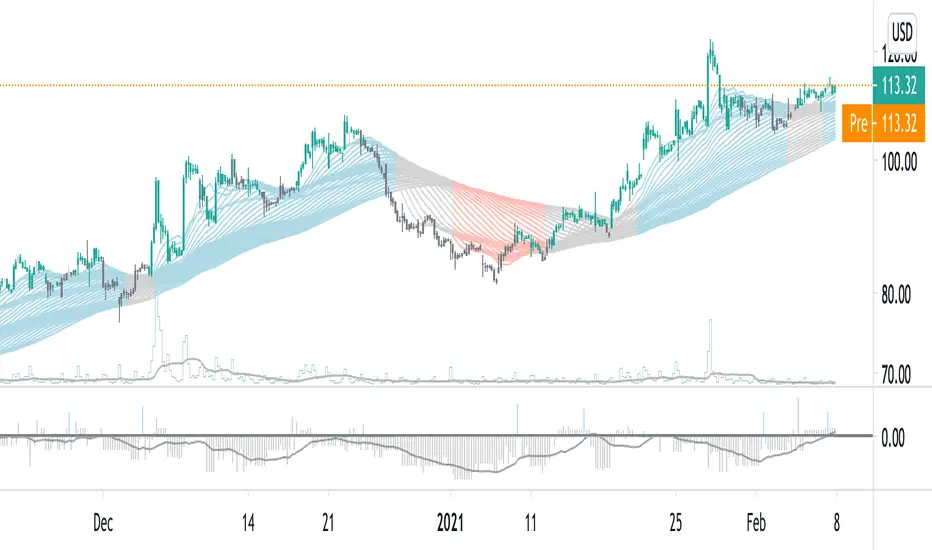
For example, the following indicator matrix was retrieved from the MRNA chart (deciscion: first 5 rows, buying; last 5 rows, no buying):
<mrna_input.txt>
1 1 0 0 0 1 1 1 1 1 0 1 0 0 1 1 0 1 1 1
1 1 0 0 1 1 1 0 0 0 1 0 1 1 0 1 0 1 1 1
0 0 1 1 0 1 0 0 0 1 1 1 0 0 1 0 0 1 0 0
1 1 0 0 0 1 1 1 1 1 1 0 1 0 0 1 0 1 0 0
0 0 1 1 0 1 1 1 0 1 1 1 0 1 1 1 0 1 0 0
1 1 0 0 1 0 1 0 0 0 0 1 0 0 0 1 0 0 1 1
1 1 0 0 0 0 1 0 0 0 0 1 0 0 1 1 0 1 1 1
0 0 0 0 1 0 1 0 0 1 1 0 0 0 0 0 0 1 0 0
0 0 0 0 0 0 1 0 0 0 1 0 0 1 0 0 0 1 1 1
0 0 0 0 1 0 1 0 0 0 1 0 1 0 0 0 0 1 1 1
This matrix is then used as an input to train the machine learning network. With a correlated buying decision matrix as an output:
<output.txt>
1
1
1
1
1
0
0
0
0
0
After training, the corrected weight matrix can be applied back to the indicator. And the display mode can be changed from a heatmap into a histogram to reveal buying signals visually.
Usage:
python stock_ml.py mrna_input.txt output.txt
Weight matrix output:
1.37639407
1.67969656
1.0162141
1.3184323
-1.88888442
8.32928588
-5.35777295
3.08739916
3.06464844
0.82986227
-0.53092333
-1.95045383
4.14441698
2.99179435
-0.08379438
1.70379704
0.4173048
-1.51870972
-2.14284707
-2.08513252
Corresponding indicators to the weight matrix:
1. Breakout
2. Reversal
3. Crossover of ema20 and ema60
4. Crossover of ema20 and ema120
5. MACD golden cross
6. Long cycle (MACD crossover 0)
7. RSI not overbought
8. KD not overbought and crossover
9. OBV uptrend
10. Bullish gap
11. High volume
12. Breakout up fractal
13. Rebounce of down fractal
14. Convergence
15. Turbulence reversal
16. Low resistance
17. Bullish trend (blue zone)
18. Bearish trend (red zone)
19. VIX close above ema20
20. SPY close below ema20
PS. It is recommended not to use default settings but to train your weight matrix based on underlying and timeframe.
Here, I apply machine learning using a simple sigmoid neuron network with one hidden layer and a single node to avoid artifacts. For the ease of data collection, the indicator matrix is first shown as a heatmap. Once an uptrend signal window is selected manually, an indicator matrix can be recorded in a binary format (i.e., 1 0 0 1 1 0, etc.).
For example, the following indicator matrix was retrieved from the MRNA chart (deciscion: first 5 rows, buying; last 5 rows, no buying):
<mrna_input.txt>
1 1 0 0 0 1 1 1 1 1 0 1 0 0 1 1 0 1 1 1
1 1 0 0 1 1 1 0 0 0 1 0 1 1 0 1 0 1 1 1
0 0 1 1 0 1 0 0 0 1 1 1 0 0 1 0 0 1 0 0
1 1 0 0 0 1 1 1 1 1 1 0 1 0 0 1 0 1 0 0
0 0 1 1 0 1 1 1 0 1 1 1 0 1 1 1 0 1 0 0
1 1 0 0 1 0 1 0 0 0 0 1 0 0 0 1 0 0 1 1
1 1 0 0 0 0 1 0 0 0 0 1 0 0 1 1 0 1 1 1
0 0 0 0 1 0 1 0 0 1 1 0 0 0 0 0 0 1 0 0
0 0 0 0 0 0 1 0 0 0 1 0 0 1 0 0 0 1 1 1
0 0 0 0 1 0 1 0 0 0 1 0 1 0 0 0 0 1 1 1
This matrix is then used as an input to train the machine learning network. With a correlated buying decision matrix as an output:
<output.txt>
1
1
1
1
1
0
0
0
0
0
After training, the corrected weight matrix can be applied back to the indicator. And the display mode can be changed from a heatmap into a histogram to reveal buying signals visually.
Usage:
python stock_ml.py mrna_input.txt output.txt
Weight matrix output:
1.37639407
1.67969656
1.0162141
1.3184323
-1.88888442
8.32928588
-5.35777295
3.08739916
3.06464844
0.82986227
-0.53092333
-1.95045383
4.14441698
2.99179435
-0.08379438
1.70379704
0.4173048
-1.51870972
-2.14284707
-2.08513252
Corresponding indicators to the weight matrix:
1. Breakout
2. Reversal
3. Crossover of ema20 and ema60
4. Crossover of ema20 and ema120
5. MACD golden cross
6. Long cycle (MACD crossover 0)
7. RSI not overbought
8. KD not overbought and crossover
9. OBV uptrend
10. Bullish gap
11. High volume
12. Breakout up fractal
13. Rebounce of down fractal
14. Convergence
15. Turbulence reversal
16. Low resistance
17. Bullish trend (blue zone)
18. Bearish trend (red zone)
19. VIX close above ema20
20. SPY close below ema20
PS. It is recommended not to use default settings but to train your weight matrix based on underlying and timeframe.
發行說明
Change the value of %K from 140 to 90.開源腳本
秉持TradingView一貫精神,這個腳本的創作者將其設為開源,以便交易者檢視並驗證其功能。向作者致敬!您可以免費使用此腳本,但請注意,重新發佈代碼需遵守我們的社群規範。
免責聲明
這些資訊和出版物並非旨在提供,也不構成TradingView提供或認可的任何形式的財務、投資、交易或其他類型的建議或推薦。請閱讀使用條款以了解更多資訊。
免責聲明
這些資訊和出版物並非旨在提供,也不構成TradingView提供或認可的任何形式的財務、投資、交易或其他類型的建議或推薦。請閱讀使用條款以了解更多資訊。