OPEN-SOURCE SCRIPT
Bollingers Bands Fibonacci ratios_copy of FOMO
Bollinger Bands Fibonacci Ratios (FiBB)
This TradingView script is a powerful tool that combines the classic Bollinger Bands with Fibonacci ratios to help traders identify potential support and resistance zones based on market volatility.
Key Features:
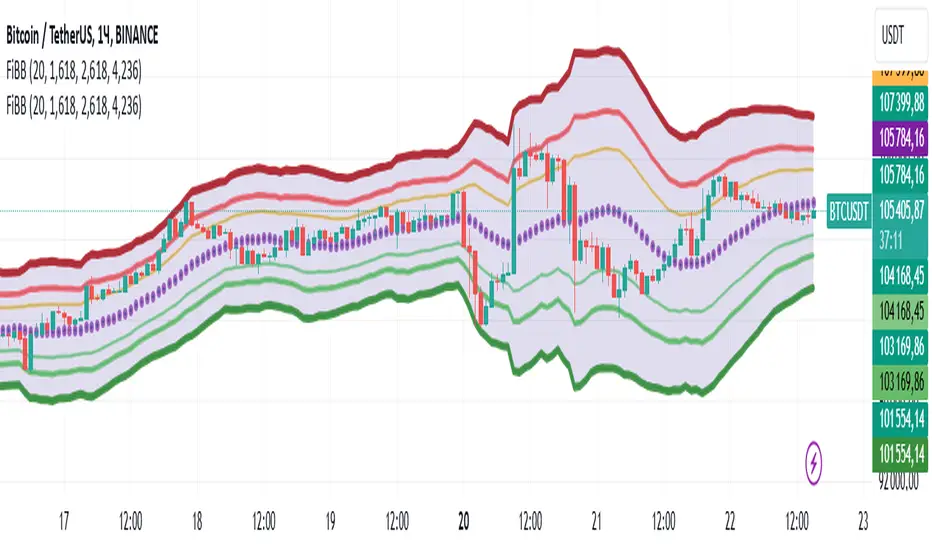
Dynamic Fibonacci Levels: The script calculates additional levels around a Simple Moving Average (SMA) using Fibonacci ratios (default: 1.618, 2.618, and 4.236). These levels adapt to market volatility using the Average True Range (ATR).
Customizable Parameters: Users can modify the length of the SMA and the Fibonacci ratios to fit their trading strategy and time frame.
Visual Representation: The indicator plots three upper and three lower bands, with color-coded transparency for easy interpretation.
Central SMA Line: The core SMA line provides a baseline for price movement and trend direction.
Shaded Range: The script visually fills the area between the outermost bands to highlight the overall range of price action.
How to Use:
Use the upper bands as potential resistance zones and the lower bands as potential support zones.
Look for price interactions with these levels to identify opportunities for breakout, trend continuation, or reversal trades.
Combine with other indicators or price action analysis to enhance decision-making.
This script is ideal for traders who want a unique blend of Fibonacci-based analysis and Bollinger Bands to better navigate market movements.
This TradingView script is a powerful tool that combines the classic Bollinger Bands with Fibonacci ratios to help traders identify potential support and resistance zones based on market volatility.
Key Features:
Dynamic Fibonacci Levels: The script calculates additional levels around a Simple Moving Average (SMA) using Fibonacci ratios (default: 1.618, 2.618, and 4.236). These levels adapt to market volatility using the Average True Range (ATR).
Customizable Parameters: Users can modify the length of the SMA and the Fibonacci ratios to fit their trading strategy and time frame.
Visual Representation: The indicator plots three upper and three lower bands, with color-coded transparency for easy interpretation.
Central SMA Line: The core SMA line provides a baseline for price movement and trend direction.
Shaded Range: The script visually fills the area between the outermost bands to highlight the overall range of price action.
How to Use:
Use the upper bands as potential resistance zones and the lower bands as potential support zones.
Look for price interactions with these levels to identify opportunities for breakout, trend continuation, or reversal trades.
Combine with other indicators or price action analysis to enhance decision-making.
This script is ideal for traders who want a unique blend of Fibonacci-based analysis and Bollinger Bands to better navigate market movements.
開源腳本
秉持TradingView一貫精神,這個腳本的創作者將其設為開源,以便交易者檢視並驗證其功能。向作者致敬!您可以免費使用此腳本,但請注意,重新發佈代碼需遵守我們的社群規範。
免責聲明
這些資訊和出版物並非旨在提供,也不構成TradingView提供或認可的任何形式的財務、投資、交易或其他類型的建議或推薦。請閱讀使用條款以了解更多資訊。
免責聲明
這些資訊和出版物並非旨在提供,也不構成TradingView提供或認可的任何形式的財務、投資、交易或其他類型的建議或推薦。請閱讀使用條款以了解更多資訊。