OPEN-SOURCE SCRIPT
Lorentzian Theory Classifier
🧮 Lorentzian Theory Classifier: An Observatory for Market Spacetime
Transcend the flat plane of traditional charting. Enter the curved, dynamic reality of market spacetime. The Lorentzian Theory Classifier (LTC) is not an indicator; it is a computational observatory. It is an instrument engineered to decode the geometry of market behavior, revealing the hidden curvatures and resonant frequencies that precede significant turning points.
We discard the outdated tools of Euclidean simplicity and embrace a more profound truth: financial markets, much like the cosmos described by general relativity, are governed by a fabric that is warped by the mass of participation and the energy of volatility. The LTC is your lens to perceive this fabric, to move beyond predicting lines on a chart and begin reading the very architecture of probability.
The Resonance Manifold: Standard Euclidean models search for historical analogues within a rigid sphere, missing the crucial outliers that define market extremes. The LTC's Lorentzian Resonance engine operates in a curved, non-Euclidean space, allowing it to connect with these "fat-tail" events—the true genesis points of major reversals.
🌌 THE THEORETICAL FRAMEWORK: A new Grand Unified Theory of Market Analysis
The LTC is built upon a revolutionary synthesis of concepts from special relativity, quantum mechanics, and information theory. It reframes market analysis not as a problem of forecasting, but as a problem of state recognition in a non-Euclidean manifold.
1. The Lorentzian Kernel: The Mathematics of Reality
Financial markets are not Gaussian. Their reality is one of "fat tails"—sudden, high-impact events that standard models dismiss as anomalies. The LTC acknowledges this reality by using the mathematically pure and robust Lorentzian kernel as its core engine:
[code]Similarity(x, y) = 1 / (1 + (||x − y||² / γ²))[/code]
||x − y||²: The squared distance between the current market state (x) and a historical state (y) in our 8-dimensional feature space.
γ (Gamma): A dynamic bandwidth parameter, our "Lorentz factor," which adapts to market entropy (chaos). In calm markets, gamma is small, demanding precise resonance. In chaotic markets, gamma expands, intelligently seeking broader patterns.
This heavy-tailed function is revolutionary. It correctly assigns profound significance to the rare, extreme events that truly define market structure, while gracefully tuning out the noise of mundane price action. It doesn't just calculate; it understands context.
2. The 8-Dimensional State Vector: The Market's Quantum Fingerprint
To achieve a holistic view, the LTC projects the market onto an 8-dimensional Hilbert space, where each dimension represents a critical "observable":
*Momentum & Acceleration (f_rsi, f_roc): The market's velocity and its rate of change.
*Cyclical Position (f_stoch, f_cci): The market's location within its recent oscillation cycles.
*Energy & Participation (f_vol, f_cor): The force of capital flow and its harmony with price.
*Chaos & Uncertainty (f_ent, f_mom): The degree of randomness and the standardized force of price changes.
These are not eight separate indicators. They are entangled properties of a single "market wavefunction." The LTC's genius lies in measuring the geometric distance between these complete quantum states.
3. The k-NN Oracle: A Council of Past Universes
The LTC employs a k-Nearest Neighbors algorithm, but in our curved Lorentzian spacetime. It poses a constant, profound question: "Which moments in history are most geometrically congruent to the present moment across all eight dimensions?"
It then summons a "council" of these historical neighbors. Each neighbor's future outcome (did price ascend or descend?) casts a vote, weighted by its resonant similarity. The result is a probabilistic forecast of stunning clarity:
*Prognosis: The final weighted consensus on future direction.
*Assurance: The degree of unanimity within the council—a direct measure of the prediction's confidence.
The Funnel of Conviction: The LTC's process is a rigorous distillation of information. Raw, chaotic market data is resolved into a clean 8-dimensional state vector. The Lorentzian Kernel filters these states for resonance, which are then passed to the k-NN Oracle for a vote. Noise is eliminated at each stage, resulting in a single, validated, high-conviction signal.
⚙️ THE COMMAND CONSOLE: A Guide to Calibrating Your Observatory
Mastering the LTC's inputs is to become an architect of your own analytical universe. Each parameter is a dial that tunes the observatory's focus, from galactic structures to subatomic fluctuations. The tooltips in-script—over 6,000 words of documentation—provide immediate reference; this guide provides the philosophy.
A summarized guide to the Core, Signal, Supreme, and Visual controls is included directly in the indicator's code and tooltips. We encourage all users to explore these settings to tune the LTC to their unique analytical style.
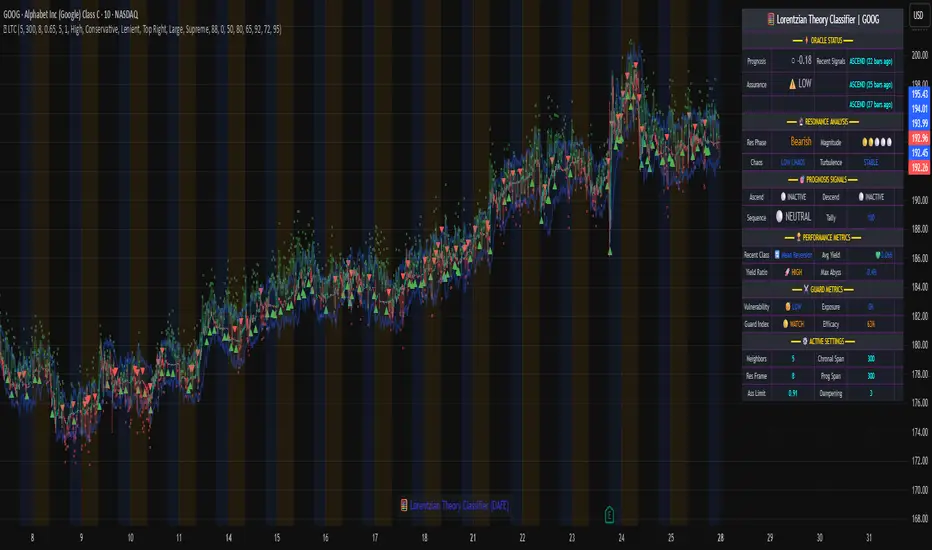
🏆 THE SUPREME DASHBOARD: Your Mission Control
The dashboard is not a data table; it is your command interface with market reality. It translates the intricate dance of probabilities and vectors into clear, actionable intelligence.
⚡ ORACLE STATUS
*Prognosis: The primary directional vector. Its color, magnitude, and emoji (⚡) reveal the strength and conviction of the Oracle's forward guidance.
*Assurance: A real-time gauge of prediction quality, from "LOW" (high uncertainty) to "ELITE" (overwhelming statistical consensus). Interpret this as your core risk metric: trade with conviction when Assurance is ELITE; trade with caution when it is LOW.
🔮 RESONANCE ANALYSIS
*Chaos: A direct measurement of market entropy. "LOW CHAOS" signifies a predictable, orderly regime. "HIGH CHAOS" is a warning of randomness and unpredictability, where trend-following logic may fail.
*Turbulence: A measure of raw volatility. When the market is "TURBULENT," expect wider price swings and increased risk. Use this metric to adjust stop-loss distances and profit targets dynamically.
🏆 PERFORMANCE & ⚔️ GUARD METRICS
These sections provide illustrative statistics on the script's recent historical behavior. Metrics like Yield Ratio and Guard Index offer a quick heuristic on the prevailing risk-reward environment. Crucially, these are for observational context only and are not a substitute for your own rigorous testing and analysis.
🎨 THE VISUAL MANIFESTATION: Charting the Unseen
The LTC's visuals are designed to transform your chart from a 2D price graph into a 4D informational battlespace.
*The Dynamic Aura (Background Color): This is the ambient energy field of the market. A luminous green (Ascend) signifies a bullish resonance field; a deep red (Descend) indicates bearish pressure.
*The Assurance Shroud (Blue Bands): A visualization of confidence. When the shroud is wide and expansive, the Oracle's vision is clear and its predictions are robust.
*The Prognosis Arc (Curved Line): A geodesic projection of the market's most likely path, based on the current Prognosis.
*The Turbulence Cloud (Orange Mist): A visual warning system for market chaos. When this entropic mist expands, it is a clear sign that you are navigating a nebula of high unpredictability.
*Oracle Markers (▲▼): The final, validated signals. These are not merely pivot points. They are moments in spacetime where a structural pivot has been confirmed and then ratified by a high-conviction vote from the Lorentzian Oracle. They are the pinnacles of confluence.
The Analyst's Observatory: The LTC transforms your chart into a command center for market analysis, providing a complete, at-a-glance view of market state, risk, and probabilistic trajectory.
🔧 THE ARCHITECT'S VISION: From a Blank Slate to a New Cosmos
The LTC was not assembled; it was derived. It began not with code, but with first principles, asking: "If we were to build an instrument to measure the market today, unbound by the technical dogmas of the 20th century, what would it look like?" The answer was clear: it must be multi-dimensional, it must be adaptive, and it must be built on a mathematical framework that respects the "fat-tailed" nature of reality.
The decision to use a pure Lorentzian kernel was non-negotiable. It represented a commitment to intellectual honesty over computational ease. The development of the Supreme Dashboard was driven by the philosophy of the "glass cockpit"—a belief that a trader's greatest asset is not a black box signal, but a transparent and intuitive flow of high-quality information. This script is the result of that unwavering vision: to create not just another indicator, but a new lens through which to perceive the market.
⚠️ RISK DISCLOSURE & PHILOSOPHY OF USE
The Lorentzian Theory Classifier is an instrument of profound analytical power, intended for the serious, discerning trader. It does not generate infallible signals. It generates high-probability, data-driven hypotheses based on a rigorous and transparent methodology. All trading involves substantial risk, and the future is fundamentally unknowable. Past performance, whether real or simulated, is no guarantee of future results. Use this tool to augment your own skill, to confirm your own analysis, and to manage your own risk within a well-defined trading plan.
"The effort to understand the universe is one of the very few things that lifts human life a little above the level of farce, and gives it some of the grace of tragedy."
— Steven Weinberg, Nobel Laureate in Physics
Trade with rigor. Trade with perspective. Trade with enlightenment. Trade with insight. Trade with anticipation.
— Dskyz, for DAFE Trading Systems
Transcend the flat plane of traditional charting. Enter the curved, dynamic reality of market spacetime. The Lorentzian Theory Classifier (LTC) is not an indicator; it is a computational observatory. It is an instrument engineered to decode the geometry of market behavior, revealing the hidden curvatures and resonant frequencies that precede significant turning points.
We discard the outdated tools of Euclidean simplicity and embrace a more profound truth: financial markets, much like the cosmos described by general relativity, are governed by a fabric that is warped by the mass of participation and the energy of volatility. The LTC is your lens to perceive this fabric, to move beyond predicting lines on a chart and begin reading the very architecture of probability.
The Resonance Manifold: Standard Euclidean models search for historical analogues within a rigid sphere, missing the crucial outliers that define market extremes. The LTC's Lorentzian Resonance engine operates in a curved, non-Euclidean space, allowing it to connect with these "fat-tail" events—the true genesis points of major reversals.
🌌 THE THEORETICAL FRAMEWORK: A new Grand Unified Theory of Market Analysis
The LTC is built upon a revolutionary synthesis of concepts from special relativity, quantum mechanics, and information theory. It reframes market analysis not as a problem of forecasting, but as a problem of state recognition in a non-Euclidean manifold.
1. The Lorentzian Kernel: The Mathematics of Reality
Financial markets are not Gaussian. Their reality is one of "fat tails"—sudden, high-impact events that standard models dismiss as anomalies. The LTC acknowledges this reality by using the mathematically pure and robust Lorentzian kernel as its core engine:
[code]Similarity(x, y) = 1 / (1 + (||x − y||² / γ²))[/code]
||x − y||²: The squared distance between the current market state (x) and a historical state (y) in our 8-dimensional feature space.
γ (Gamma): A dynamic bandwidth parameter, our "Lorentz factor," which adapts to market entropy (chaos). In calm markets, gamma is small, demanding precise resonance. In chaotic markets, gamma expands, intelligently seeking broader patterns.
This heavy-tailed function is revolutionary. It correctly assigns profound significance to the rare, extreme events that truly define market structure, while gracefully tuning out the noise of mundane price action. It doesn't just calculate; it understands context.
2. The 8-Dimensional State Vector: The Market's Quantum Fingerprint
To achieve a holistic view, the LTC projects the market onto an 8-dimensional Hilbert space, where each dimension represents a critical "observable":
*Momentum & Acceleration (f_rsi, f_roc): The market's velocity and its rate of change.
*Cyclical Position (f_stoch, f_cci): The market's location within its recent oscillation cycles.
*Energy & Participation (f_vol, f_cor): The force of capital flow and its harmony with price.
*Chaos & Uncertainty (f_ent, f_mom): The degree of randomness and the standardized force of price changes.
These are not eight separate indicators. They are entangled properties of a single "market wavefunction." The LTC's genius lies in measuring the geometric distance between these complete quantum states.
3. The k-NN Oracle: A Council of Past Universes
The LTC employs a k-Nearest Neighbors algorithm, but in our curved Lorentzian spacetime. It poses a constant, profound question: "Which moments in history are most geometrically congruent to the present moment across all eight dimensions?"
It then summons a "council" of these historical neighbors. Each neighbor's future outcome (did price ascend or descend?) casts a vote, weighted by its resonant similarity. The result is a probabilistic forecast of stunning clarity:
*Prognosis: The final weighted consensus on future direction.
*Assurance: The degree of unanimity within the council—a direct measure of the prediction's confidence.
The Funnel of Conviction: The LTC's process is a rigorous distillation of information. Raw, chaotic market data is resolved into a clean 8-dimensional state vector. The Lorentzian Kernel filters these states for resonance, which are then passed to the k-NN Oracle for a vote. Noise is eliminated at each stage, resulting in a single, validated, high-conviction signal.
⚙️ THE COMMAND CONSOLE: A Guide to Calibrating Your Observatory
Mastering the LTC's inputs is to become an architect of your own analytical universe. Each parameter is a dial that tunes the observatory's focus, from galactic structures to subatomic fluctuations. The tooltips in-script—over 6,000 words of documentation—provide immediate reference; this guide provides the philosophy.
A summarized guide to the Core, Signal, Supreme, and Visual controls is included directly in the indicator's code and tooltips. We encourage all users to explore these settings to tune the LTC to their unique analytical style.
🏆 THE SUPREME DASHBOARD: Your Mission Control
The dashboard is not a data table; it is your command interface with market reality. It translates the intricate dance of probabilities and vectors into clear, actionable intelligence.
⚡ ORACLE STATUS
*Prognosis: The primary directional vector. Its color, magnitude, and emoji (⚡) reveal the strength and conviction of the Oracle's forward guidance.
*Assurance: A real-time gauge of prediction quality, from "LOW" (high uncertainty) to "ELITE" (overwhelming statistical consensus). Interpret this as your core risk metric: trade with conviction when Assurance is ELITE; trade with caution when it is LOW.
🔮 RESONANCE ANALYSIS
*Chaos: A direct measurement of market entropy. "LOW CHAOS" signifies a predictable, orderly regime. "HIGH CHAOS" is a warning of randomness and unpredictability, where trend-following logic may fail.
*Turbulence: A measure of raw volatility. When the market is "TURBULENT," expect wider price swings and increased risk. Use this metric to adjust stop-loss distances and profit targets dynamically.
🏆 PERFORMANCE & ⚔️ GUARD METRICS
These sections provide illustrative statistics on the script's recent historical behavior. Metrics like Yield Ratio and Guard Index offer a quick heuristic on the prevailing risk-reward environment. Crucially, these are for observational context only and are not a substitute for your own rigorous testing and analysis.
🎨 THE VISUAL MANIFESTATION: Charting the Unseen
The LTC's visuals are designed to transform your chart from a 2D price graph into a 4D informational battlespace.
*The Dynamic Aura (Background Color): This is the ambient energy field of the market. A luminous green (Ascend) signifies a bullish resonance field; a deep red (Descend) indicates bearish pressure.
*The Assurance Shroud (Blue Bands): A visualization of confidence. When the shroud is wide and expansive, the Oracle's vision is clear and its predictions are robust.
*The Prognosis Arc (Curved Line): A geodesic projection of the market's most likely path, based on the current Prognosis.
*The Turbulence Cloud (Orange Mist): A visual warning system for market chaos. When this entropic mist expands, it is a clear sign that you are navigating a nebula of high unpredictability.
*Oracle Markers (▲▼): The final, validated signals. These are not merely pivot points. They are moments in spacetime where a structural pivot has been confirmed and then ratified by a high-conviction vote from the Lorentzian Oracle. They are the pinnacles of confluence.
The Analyst's Observatory: The LTC transforms your chart into a command center for market analysis, providing a complete, at-a-glance view of market state, risk, and probabilistic trajectory.
🔧 THE ARCHITECT'S VISION: From a Blank Slate to a New Cosmos
The LTC was not assembled; it was derived. It began not with code, but with first principles, asking: "If we were to build an instrument to measure the market today, unbound by the technical dogmas of the 20th century, what would it look like?" The answer was clear: it must be multi-dimensional, it must be adaptive, and it must be built on a mathematical framework that respects the "fat-tailed" nature of reality.
The decision to use a pure Lorentzian kernel was non-negotiable. It represented a commitment to intellectual honesty over computational ease. The development of the Supreme Dashboard was driven by the philosophy of the "glass cockpit"—a belief that a trader's greatest asset is not a black box signal, but a transparent and intuitive flow of high-quality information. This script is the result of that unwavering vision: to create not just another indicator, but a new lens through which to perceive the market.
⚠️ RISK DISCLOSURE & PHILOSOPHY OF USE
The Lorentzian Theory Classifier is an instrument of profound analytical power, intended for the serious, discerning trader. It does not generate infallible signals. It generates high-probability, data-driven hypotheses based on a rigorous and transparent methodology. All trading involves substantial risk, and the future is fundamentally unknowable. Past performance, whether real or simulated, is no guarantee of future results. Use this tool to augment your own skill, to confirm your own analysis, and to manage your own risk within a well-defined trading plan.
"The effort to understand the universe is one of the very few things that lifts human life a little above the level of farce, and gives it some of the grace of tragedy."
— Steven Weinberg, Nobel Laureate in Physics
Trade with rigor. Trade with perspective. Trade with enlightenment. Trade with insight. Trade with anticipation.
— Dskyz, for DAFE Trading Systems
開源腳本
秉持TradingView一貫精神,這個腳本的創作者將其設為開源,以便交易者檢視並驗證其功能。向作者致敬!您可以免費使用此腳本,但請注意,重新發佈代碼需遵守我們的社群規範。
Empowering everyday traders and DAFE Trading Systems
DAFETradingSystems.com
DAFETradingSystems.com
免責聲明
這些資訊和出版物並非旨在提供,也不構成TradingView提供或認可的任何形式的財務、投資、交易或其他類型的建議或推薦。請閱讀使用條款以了解更多資訊。
開源腳本
秉持TradingView一貫精神,這個腳本的創作者將其設為開源,以便交易者檢視並驗證其功能。向作者致敬!您可以免費使用此腳本,但請注意,重新發佈代碼需遵守我們的社群規範。
Empowering everyday traders and DAFE Trading Systems
DAFETradingSystems.com
DAFETradingSystems.com
免責聲明
這些資訊和出版物並非旨在提供,也不構成TradingView提供或認可的任何形式的財務、投資、交易或其他類型的建議或推薦。請閱讀使用條款以了解更多資訊。