OPEN-SOURCE SCRIPT
已更新 Relative Volume Prices Index by @WilliamBelini
What is the impact for Volume to the Prices?
To respond this question, I formulate the hipótesis if a little Volume change a lot the Price, it's a reversion signal, and if a lot of Volume change a little the price, it´s because the price is established.
This is one of 3 indicators created to improve this hipótesis, named:
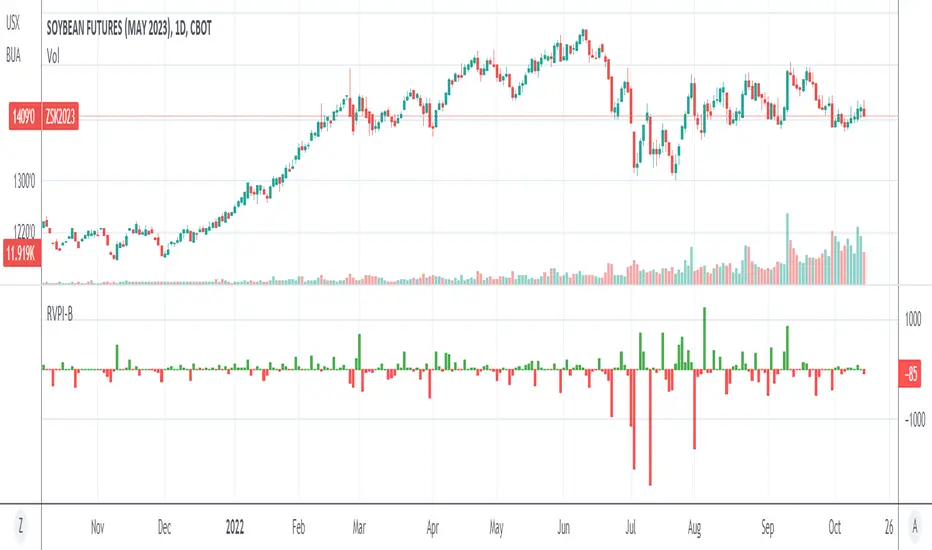
1. Relative Volume Prices Index by @WilliamBelini (RVPI)
2. Relative Market Status by @WilliamBelini (RMS)
3. Trade Trigger RVPI by @WilliamBelini (TTR)
- The first show you the effect from volume to the prices, meas the sensibility of the variation;
- The second show you the feeling of the market by cicles, based at the cumulative average sensibility from the RVPI indicator;
- The third show you a trigger to trading positions, with the analysis of the historical RVPI data, based on the normal distribution of the futures price variation, by previos RVPI values and some rules created based on data behaviors identified.
To the end of this work, I can comprove the hipótesis, with simulations trading based from the TTR.
How we can´t monetize our work here, on TradingView platform, I´m disponibilize 2 of 3 indicators for you here free. If you want to have the third, discover how to contact with me (@ ;), and for me will be a pleasure to help you.
To respond this question, I formulate the hipótesis if a little Volume change a lot the Price, it's a reversion signal, and if a lot of Volume change a little the price, it´s because the price is established.
This is one of 3 indicators created to improve this hipótesis, named:
1. Relative Volume Prices Index by @WilliamBelini (RVPI)
2. Relative Market Status by @WilliamBelini (RMS)
3. Trade Trigger RVPI by @WilliamBelini (TTR)
- The first show you the effect from volume to the prices, meas the sensibility of the variation;
- The second show you the feeling of the market by cicles, based at the cumulative average sensibility from the RVPI indicator;
- The third show you a trigger to trading positions, with the analysis of the historical RVPI data, based on the normal distribution of the futures price variation, by previos RVPI values and some rules created based on data behaviors identified.
To the end of this work, I can comprove the hipótesis, with simulations trading based from the TTR.
How we can´t monetize our work here, on TradingView platform, I´m disponibilize 2 of 3 indicators for you here free. If you want to have the third, discover how to contact with me (@ ;), and for me will be a pleasure to help you.
發行說明
Update the demonstration chart.發行說明
Include Volume Indicator to the visualization chart.發行說明
Deleted unnecessary inputs.開源腳本
秉持TradingView一貫精神,這個腳本的創作者將其設為開源,以便交易者檢視並驗證其功能。向作者致敬!您可以免費使用此腳本,但請注意,重新發佈代碼需遵守我們的社群規範。
免責聲明
這些資訊和出版物並非旨在提供,也不構成TradingView提供或認可的任何形式的財務、投資、交易或其他類型的建議或推薦。請閱讀使用條款以了解更多資訊。
免責聲明
這些資訊和出版物並非旨在提供,也不構成TradingView提供或認可的任何形式的財務、投資、交易或其他類型的建議或推薦。請閱讀使用條款以了解更多資訊。