OPEN-SOURCE SCRIPT
Trend Dominance Multi Timeframe [Misu]
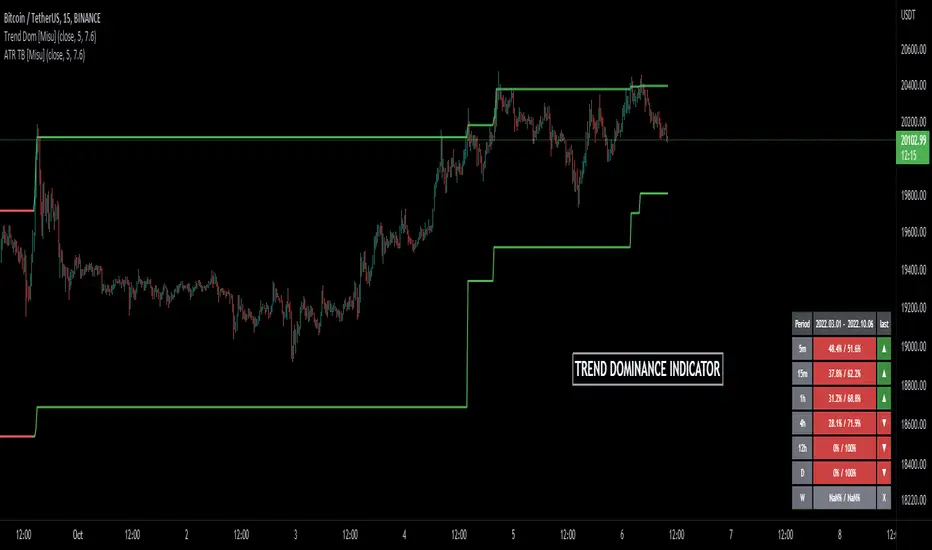
█ This indicator shows the repartition of bullish and bearish trends over a certain period in multiple timeframes. It's also showing the trending direction at the time.
█ Usages:
Trend dominance is expressed with two percentages: left is downtrend and right is uptrend. Cell colors turn green if dominance is up and red if it is down.

Knowing the trend dominance allows you to have a better overview of the market conditions.
You can use it to your advantage to favor long or short trades, reversal or breakout strategies, etc.
█ Features:
> Table colors
> Instant Trend Multitimeframe
> Trend Dominance Multitimeframe
█ Parameters:
> Length: Length is used to calculate ATR.
> Atr Multiplier: A factor used to balance the impact of the ATR on the Trend Bands calculation.
> UI Settings
█ Usages:
Trend dominance is expressed with two percentages: left is downtrend and right is uptrend. Cell colors turn green if dominance is up and red if it is down.
Knowing the trend dominance allows you to have a better overview of the market conditions.
You can use it to your advantage to favor long or short trades, reversal or breakout strategies, etc.
█ Features:
> Table colors
> Instant Trend Multitimeframe
> Trend Dominance Multitimeframe
█ Parameters:
> Length: Length is used to calculate ATR.
> Atr Multiplier: A factor used to balance the impact of the ATR on the Trend Bands calculation.
> UI Settings
發行說明
Change chart.開源腳本
本著TradingView的真正精神,此腳本的創建者將其開源,以便交易者可以查看和驗證其功能。向作者致敬!雖然您可以免費使用它,但請記住,重新發佈程式碼必須遵守我們的網站規則。
免責聲明
這些資訊和出版物並不意味著也不構成TradingView提供或認可的金融、投資、交易或其他類型的意見或建議。請在使用條款閱讀更多資訊。
開源腳本
本著TradingView的真正精神,此腳本的創建者將其開源,以便交易者可以查看和驗證其功能。向作者致敬!雖然您可以免費使用它,但請記住,重新發佈程式碼必須遵守我們的網站規則。
免責聲明
這些資訊和出版物並不意味著也不構成TradingView提供或認可的金融、投資、交易或其他類型的意見或建議。請在使用條款閱讀更多資訊。