OPEN-SOURCE SCRIPT
RSI Oversold/Overbought Indicator
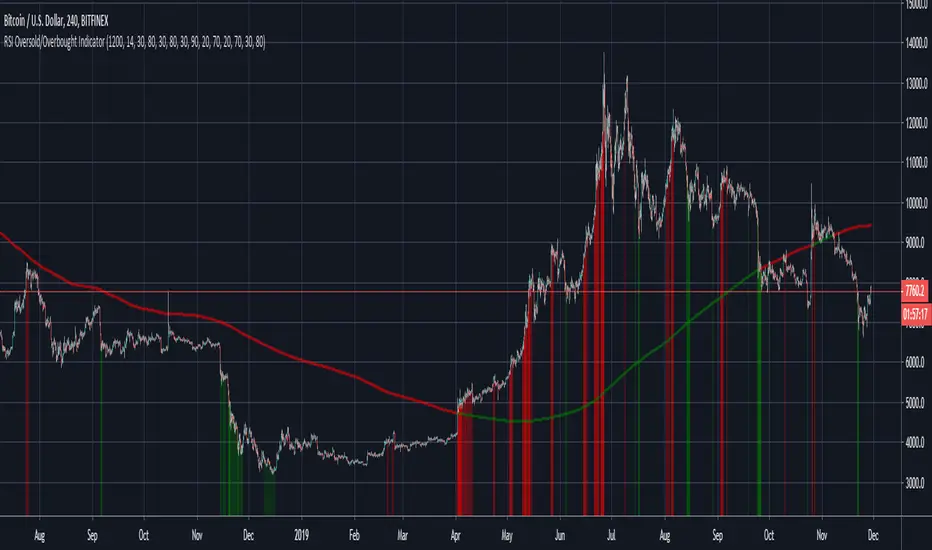
This is a very simple but quite powerful indicator which looks at the RSI simultaneously over the 4h, Daily and Weekly timeframes, and places bands on the chart when one or more timeframes move into oversold/overbought territory. For further filtering I use the 200 day SMA to determine if we are in a Bull or Bear market, which puts a bias on the RSI (30/80 in a Bull market and 20/70 in a Bear market).
The deeper the colour, the more oversold the market is. The weekly RSI can be used as an early warning sign, with the Daily/ 4h RSI useful to identify local peaks.
The deeper the colour, the more oversold the market is. The weekly RSI can be used as an early warning sign, with the Daily/ 4h RSI useful to identify local peaks.
開源腳本
秉持TradingView一貫精神,這個腳本的創作者將其設為開源,以便交易者檢視並驗證其功能。向作者致敬!您可以免費使用此腳本,但請注意,重新發佈代碼需遵守我們的社群規範。
免責聲明
這些資訊和出版物並非旨在提供,也不構成TradingView提供或認可的任何形式的財務、投資、交易或其他類型的建議或推薦。請閱讀使用條款以了解更多資訊。
開源腳本
秉持TradingView一貫精神,這個腳本的創作者將其設為開源,以便交易者檢視並驗證其功能。向作者致敬!您可以免費使用此腳本,但請注意,重新發佈代碼需遵守我們的社群規範。
免責聲明
這些資訊和出版物並非旨在提供,也不構成TradingView提供或認可的任何形式的財務、投資、交易或其他類型的建議或推薦。請閱讀使用條款以了解更多資訊。