OPEN-SOURCE SCRIPT
All-In-One: Moving Averages, Ichimoku cloud, Volume candle
Tired of install multiple basis indicators? This indicator allows you to install only one but you will have all basis indicators for your chart. Currently, it includes the following
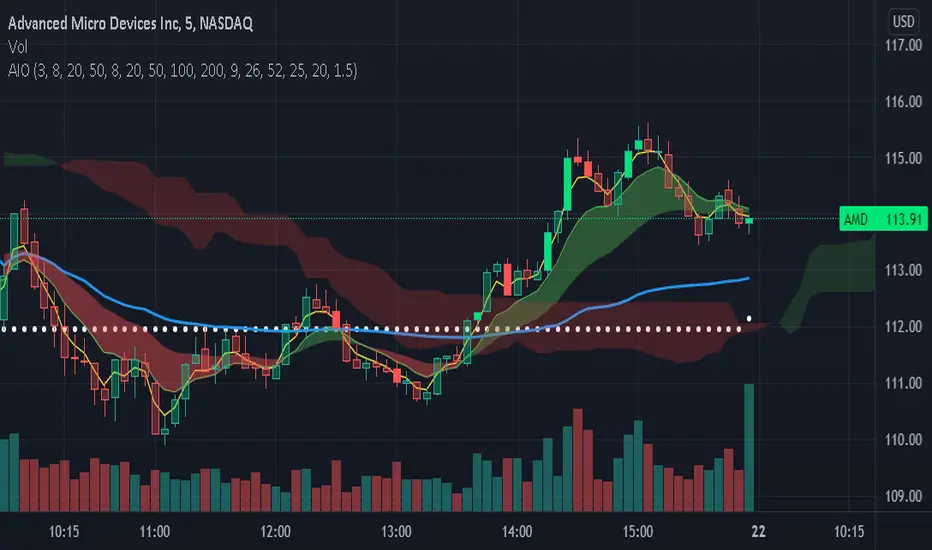
This script is particularly helpful for short timeframe chart, like M5. While it can show EMA or SAM for current time frame (up to 4 lines, user can change the length period for each lines to suit user's needs), it does plot up to 5 daily SMA lines. Default settings are for 8, 20, 50, 100, 200 SMA. The lines can be show or not be shown by the choice of user. Volume Weighted Average Price (VWAP), a technical analysis tool used to measure the average price weighted by volume, is also available in this indication.
In addition, this indicator can show two clouds: The first one is the EMA (or SMA) cloud, which plot the region between two EMA (or SMA) lines (the second and the third) of current timeframe, the second one is the Ichimoku cloud (the details of which can be found here tradingview.com/support/solutions/43000589152-ichimoku-cloud/).
The last feature is the Volume candle indicator. This indicator will highlight the candle with volume higher than volume threshold times of current simple moving average of the volume. The default setting is 1.5 * 20 period moving average of volume.
Even though this indicator has many different indicators in it, user can easily to turn off any of them.
If you have any unused tradingview coin, Comment with Cheer to support my work.
- Daily moving averages: Include 5 SMA lines
- Current timeframe moving averages: Include 4 EMA or SMA lines
- VWAP
- EMA (or SMA ) cloud, filled between EMA ( SMA ) #2 and #3 of current timeframe
- Ichimoku cloud
- Volume candle: Candle with high volume will be highlighted
This script is particularly helpful for short timeframe chart, like M5. While it can show EMA or SAM for current time frame (up to 4 lines, user can change the length period for each lines to suit user's needs), it does plot up to 5 daily SMA lines. Default settings are for 8, 20, 50, 100, 200 SMA. The lines can be show or not be shown by the choice of user. Volume Weighted Average Price (VWAP), a technical analysis tool used to measure the average price weighted by volume, is also available in this indication.
In addition, this indicator can show two clouds: The first one is the EMA (or SMA) cloud, which plot the region between two EMA (or SMA) lines (the second and the third) of current timeframe, the second one is the Ichimoku cloud (the details of which can be found here tradingview.com/support/solutions/43000589152-ichimoku-cloud/).
The last feature is the Volume candle indicator. This indicator will highlight the candle with volume higher than volume threshold times of current simple moving average of the volume. The default setting is 1.5 * 20 period moving average of volume.
Even though this indicator has many different indicators in it, user can easily to turn off any of them.
If you have any unused tradingview coin, Comment with Cheer to support my work.
開源腳本
本著TradingView的真正精神,此腳本的創建者將其開源,以便交易者可以查看和驗證其功能。向作者致敬!雖然您可以免費使用它,但請記住,重新發佈程式碼必須遵守我們的網站規則。
免責聲明
這些資訊和出版物並不意味著也不構成TradingView提供或認可的金融、投資、交易或其他類型的意見或建議。請在使用條款閱讀更多資訊。
開源腳本
本著TradingView的真正精神,此腳本的創建者將其開源,以便交易者可以查看和驗證其功能。向作者致敬!雖然您可以免費使用它,但請記住,重新發佈程式碼必須遵守我們的網站規則。
免責聲明
這些資訊和出版物並不意味著也不構成TradingView提供或認可的金融、投資、交易或其他類型的意見或建議。請在使用條款閱讀更多資訊。