OPEN-SOURCE SCRIPT
已更新 NYSE New Highs vs New Lows
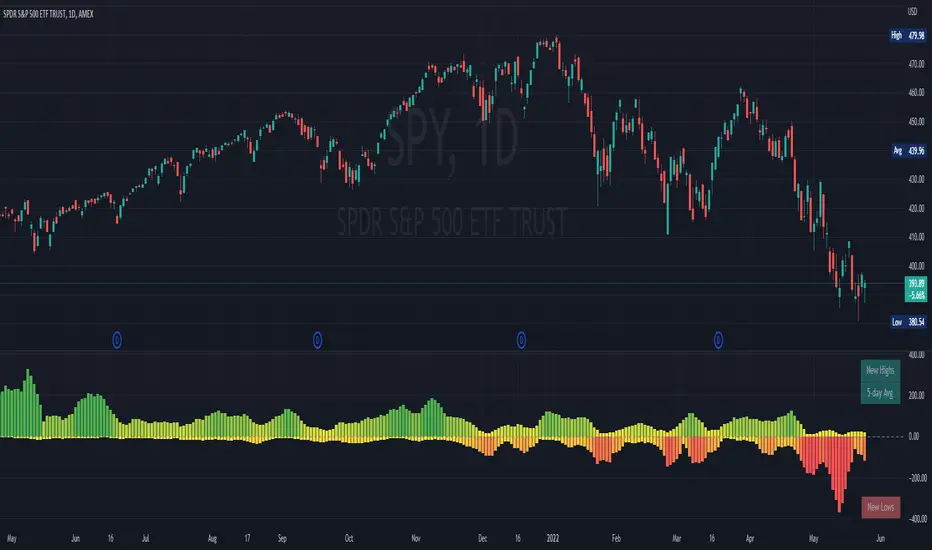
NYSE New Highs vs New Lows is a simple market breadth indicator that compares HIGN, the number of new highs during that day, and LOWN, the number of new lows. The new highs are on top and lows are appropriately on bottom. Without averaging, it's a little chaotic so you can smooth them out as much as you want, and the top-right label shows how much you're smoothing.
Interpretation:
Essentially, we use SPY or
  QQQ as a proxy for what's going on in the market, but because the FAANG stocks are so heavily weighted, it's not always representative. If SPY is flat/down, but there are 200 new highs today, then one of the big boys is weighing down an otherwise very bullish market. It's like looking at one of those heatmap charts, but in a single number.
Bullish Trend
- Lots of new highs
- Very few new lows
Bearish Trend
- Lots of new lows
- Very few new highs
Potential Reversal
- Too high, 250+
- Too low, 150+
Interpretation:
Essentially, we use
Bullish Trend
- Lots of new highs
- Very few new lows
Bearish Trend
- Lots of new lows
- Very few new highs
Potential Reversal
- Too high, 250+
- Too low, 150+
發行說明
Added option for cumulative count. Adjusted line/column colors. Label always said "day" even when it was on weekly so had to figure that out. 開源腳本
本著TradingView的真正精神,此腳本的創建者將其開源,以便交易者可以查看和驗證其功能。向作者致敬!雖然您可以免費使用它,但請記住,重新發佈程式碼必須遵守我們的網站規則。
免責聲明
這些資訊和出版物並不意味著也不構成TradingView提供或認可的金融、投資、交易或其他類型的意見或建議。請在使用條款閱讀更多資訊。
開源腳本
本著TradingView的真正精神,此腳本的創建者將其開源,以便交易者可以查看和驗證其功能。向作者致敬!雖然您可以免費使用它,但請記住,重新發佈程式碼必須遵守我們的網站規則。
免責聲明
這些資訊和出版物並不意味著也不構成TradingView提供或認可的金融、投資、交易或其他類型的意見或建議。請在使用條款閱讀更多資訊。