OPEN-SOURCE SCRIPT
已更新 Change% by Amit
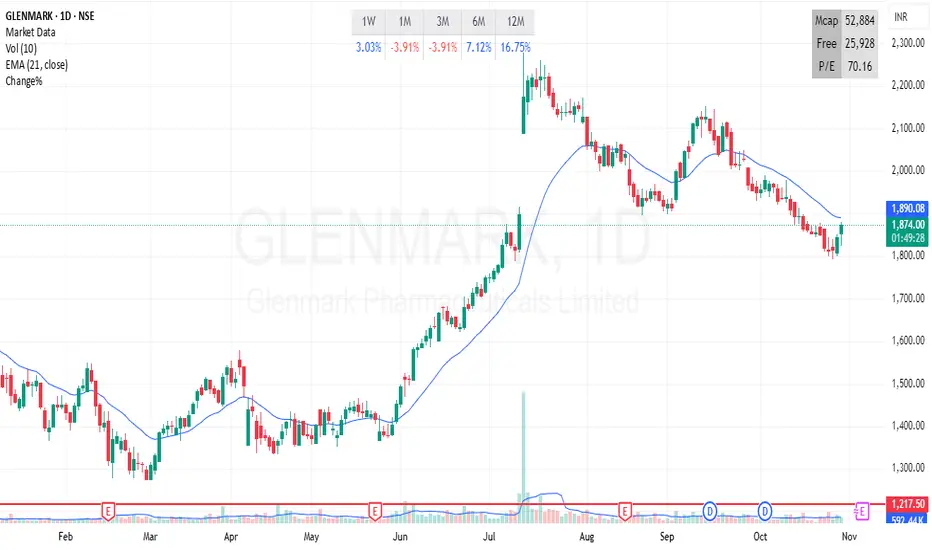
Multi-Period Returns Table
This indicator displays percentage returns across multiple timeframes —
1 Week,
1 Month,
3 Months,
6 Months,
12 Months.
This helps traders quickly assess short-term and long-term performance trends.
Positive returns are highlighted in blue, while negative returns are shown in red, allowing instant visual recognition of strength or weakness.
Ideal for spotting momentum shifts, relative performance, and trend consistency across different horizons.
發行說明
Updated version發行說明
Version 3開源腳本
本著TradingView的真正精神,此腳本的創建者將其開源,以便交易者可以查看和驗證其功能。向作者致敬!雖然您可以免費使用它,但請記住,重新發佈程式碼必須遵守我們的網站規則。
免責聲明
這些資訊和出版物並不意味著也不構成TradingView提供或認可的金融、投資、交易或其他類型的意見或建議。請在使用條款閱讀更多資訊。
開源腳本
本著TradingView的真正精神,此腳本的創建者將其開源,以便交易者可以查看和驗證其功能。向作者致敬!雖然您可以免費使用它,但請記住,重新發佈程式碼必須遵守我們的網站規則。
免責聲明
這些資訊和出版物並不意味著也不構成TradingView提供或認可的金融、投資、交易或其他類型的意見或建議。請在使用條款閱讀更多資訊。