OPEN-SOURCE SCRIPT
已更新 Tape (Time and Sales)
OVERVIEW
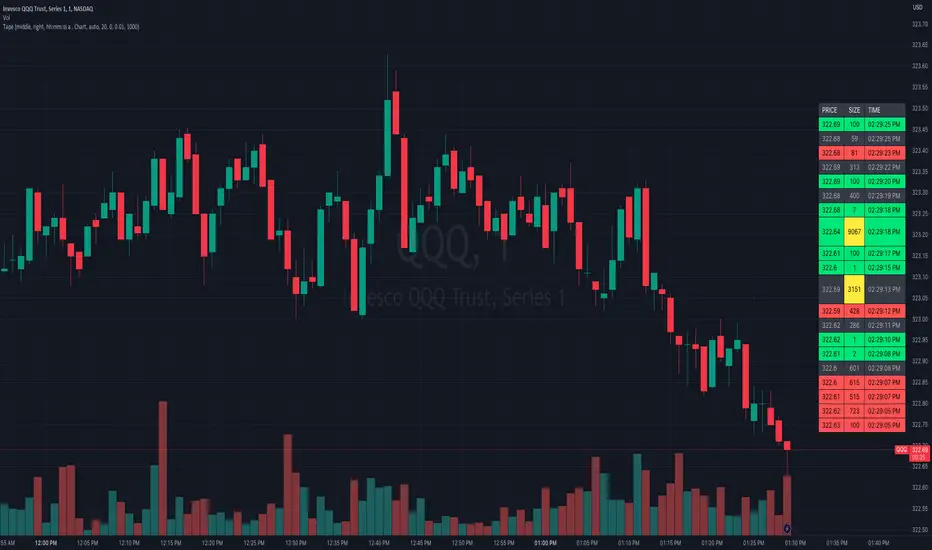
This indicator is a synthesized "Tape" (aka. Time and Sales) from real time market data. It's specifically designed to be performant, expediting trading insights and decisions.
The table contains color-coded price action, volume size, and a timestamp data for each chart update. Because chart updates are independent of exchange orders, 1 chart update may combine more than 1 exchange and/or order. Even so, you're able to see very small and fast order flow changes, made possible by measuring real time volume differentials, and correlating them with price action.
Real time volume differentials are required for this indicator to be most useful. This is not ideal for historical analysis or TradingViews Replay feature.
INPUTS
You can can configure:
DEV NOTES
This script illustrates:
This indicator is a synthesized "Tape" (aka. Time and Sales) from real time market data. It's specifically designed to be performant, expediting trading insights and decisions.
The table contains color-coded price action, volume size, and a timestamp data for each chart update. Because chart updates are independent of exchange orders, 1 chart update may combine more than 1 exchange and/or order. Even so, you're able to see very small and fast order flow changes, made possible by measuring real time volume differentials, and correlating them with price action.
Real time volume differentials are required for this indicator to be most useful. This is not ideal for historical analysis or TradingViews Replay feature.
INPUTS
You can can configure:
- Table Position and Text Size
- The Timestamp (visibility, format, timezone)
- The number of lines to print
- Volume Parameters (minimum size, large sizes, decimal precision)
- Highlighting and Enlarging large sized prints
- All the colors
DEV NOTES
This script illustrates:
- The complimentary nature of loops and arrays
- A method for iterative table management
發行說明
Minor cleanup.發行說明
Added bar volume metrics: Up, Down, Absorbed, Total, Ratio, and Move.Metrics adopt the bars timescale and reset with each new bar. They are off by default, but will display above the tape when enabled. You also have the ability to specify signal levels (where you would like each metric to be highlighted).
↑ Up is the total bar volume correlated with rising prices.
↓ Down is the total bar volume correlated with falling prices.
→ Absorbed is the total bar volume correlated with unchanging prices. Aka. the price absorbed the volume.
+ Total is the sum of all bar volume.
% Ratio is the ratio between up and down bar volume. Up volume is the numerator in positive ratios and Down volume is the numerator in negative ratios. Absorbed volume is added to the denominator of both positive and negative ratios.
⇅ Move is the bar volume of a continuous directional move. This excludes Absorbed volume.
☳ Accumulation is the bar volume accumulating at the current price. Accumulation is different from Absorbed because it includes the volume of the last price change, and resets back to 0 at the next price change.
發行說明
Added ability for traders to specify the tables frame and border (width and color).發行說明
• Minor improvements to array management.發行說明
• Inputs were set to not display in the status line, minimizing chart clutter.發行說明
Substantial edits, aimed at improving performance.• Added / set max_bars_back to 0, reducing historical buffer requirements for all variables.
• Eliminated all unnecessary var declarations to eliminate their performance penalty.
• Put the core logic inside a single iteration loop to force variables declared inside the loop to lose their historical data after each execution.
• Changed the price / volume source to be a 1 second chart, encouraging prints to be more frequent and granular.
• Added the ability to specify if the newest data should print at the top or bottom of the tape.
• Other minor changes.
發行說明
• Refined the tape inversion feature.• Adjusted setting order and display.
發行說明
• Bug fix. The ratio now resets when the bar closes, rather than being reset every tick.發行說明
• Added ability for users to specify if they have a Premium account.The print frequency and precision relies on chart updates. The most granular data non Premium users have access to is a 1 minute chart, which tends to update about once every second. This update interval can aggregate volume changes into a single print rather than showing each volume change as a unique print.
Premium accounts have access to sub-minute timeframe data, which can update intra-second. This means chart update intervals better align with volume changes, lending itself to more frequent and precise prints.
If you select "Premium" and do not in fact have a Premium account, the script may break when it tries to request data the account type does not have access to.
發行說明
- Minor performance improvements
- Added ability to toggle price column and column headers
開源腳本
秉持TradingView一貫精神,這個腳本的創作者將其設為開源,以便交易者檢視並驗證其功能。向作者致敬!您可以免費使用此腳本,但請注意,重新發佈代碼需遵守我們的社群規範。
Discord: discord.gg/bPAPhwUeud
Website: liquid-trader.com
Website: liquid-trader.com
免責聲明
這些資訊和出版物並非旨在提供,也不構成TradingView提供或認可的任何形式的財務、投資、交易或其他類型的建議或推薦。請閱讀使用條款以了解更多資訊。
開源腳本
秉持TradingView一貫精神,這個腳本的創作者將其設為開源,以便交易者檢視並驗證其功能。向作者致敬!您可以免費使用此腳本,但請注意,重新發佈代碼需遵守我們的社群規範。
Discord: discord.gg/bPAPhwUeud
Website: liquid-trader.com
Website: liquid-trader.com
免責聲明
這些資訊和出版物並非旨在提供,也不構成TradingView提供或認可的任何形式的財務、投資、交易或其他類型的建議或推薦。請閱讀使用條款以了解更多資訊。