OPEN-SOURCE SCRIPT
CSI - Calendar Seasonality Index for Bitcoin (BTC) [Logue]
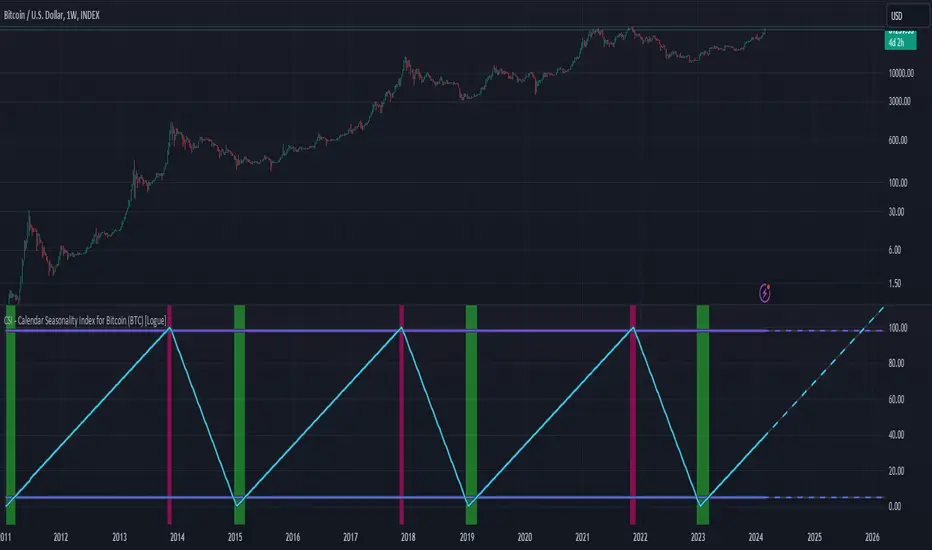
Calendar Seasonality Index (CSI) for Bitcoin (BTC) - The CSI takes advantage of the consistency of BTC cycles. Past cycles have formed macro tops every four years near November 21st, starting from in 2013. Past cycles have formed macro bottoms every four years near January 15th, starting from 2011. Therefore, a linear "risk" curve can be created between the bottom and top dates to measure how close BTC might be to a bottom or a top. The default triggers are at 98% risk for tops and 5% risk for bottoms. Extensions are also added as defaults to allow easy identification of the dates of the next top or bottom according to the CSI.
開源腳本
秉持TradingView一貫精神,這個腳本的創作者將其設為開源,以便交易者檢視並驗證其功能。向作者致敬!您可以免費使用此腳本,但請注意,重新發佈代碼需遵守我們的社群規範。
免責聲明
這些資訊和出版物並非旨在提供,也不構成TradingView提供或認可的任何形式的財務、投資、交易或其他類型的建議或推薦。請閱讀使用條款以了解更多資訊。
免責聲明
這些資訊和出版物並非旨在提供,也不構成TradingView提供或認可的任何形式的財務、投資、交易或其他類型的建議或推薦。請閱讀使用條款以了解更多資訊。