OPEN-SOURCE SCRIPT
Multiple VWMA
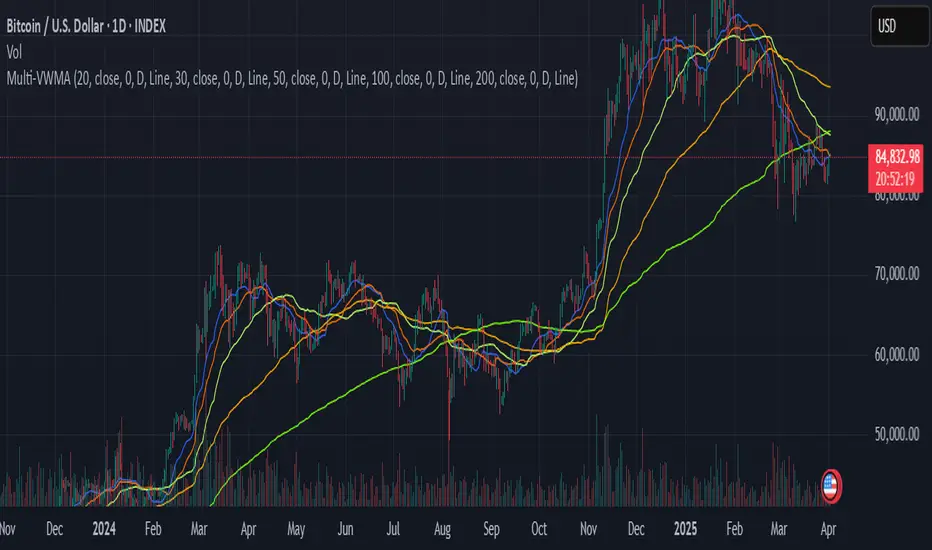
TradingView Indicator: Multiple VWMA
This TradingView indicator allows you to display up to five separate Volume Weighted Moving Averages (VWMAs) directly on your price chart.
What it does:
Plots 5 VWMAs: It calculates and draws five distinct VWMA lines (or other styles) on the chart.
Volume Weighting: Unlike simple moving averages, a VWMA gives more weight to prices where trading volume was higher, potentially offering a clearer picture of the trend strength confirmed by volume.
Highly Customizable: Each of the five VWMAs can be configured independently through the indicator's settings panel. For each one, you can set:
Length: The lookback period (number of bars) used for the calculation.
Source: The price data to use (e.g., close, open, high, low, hl2, etc.).
Timeframe: You can calculate each VWMA based on a different timeframe than the one currently displayed on your chart (e.g., view daily VWMAs on an hourly chart). Leave blank to use the chart's timeframe.
Offset: Shift the VWMA line forwards or backwards on the chart by a specific number of bars.
Style: Choose how each VWMA is displayed (Line, Histogram, or Cross).
Overlay: The VWMAs are plotted directly over the price bars for easy comparison.
Purpose:
This indicator is useful for traders who want to analyze trends using multiple volume-weighted perspectives simultaneously. By comparing VWMAs of different lengths or based on different timeframes, you can gain insights into short-term vs. long-term trends, potential support/resistance levels, and the significance of price movements based on accompanying volume.
開源腳本
秉持TradingView一貫精神,這個腳本的創作者將其設為開源,以便交易者檢視並驗證其功能。向作者致敬!您可以免費使用此腳本,但請注意,重新發佈代碼需遵守我們的社群規範。
免責聲明
這些資訊和出版物並非旨在提供,也不構成TradingView提供或認可的任何形式的財務、投資、交易或其他類型的建議或推薦。請閱讀使用條款以了解更多資訊。
免責聲明
這些資訊和出版物並非旨在提供,也不構成TradingView提供或認可的任何形式的財務、投資、交易或其他類型的建議或推薦。請閱讀使用條款以了解更多資訊。