OPEN-SOURCE SCRIPT
Gold scalper 1 min or 30 sec
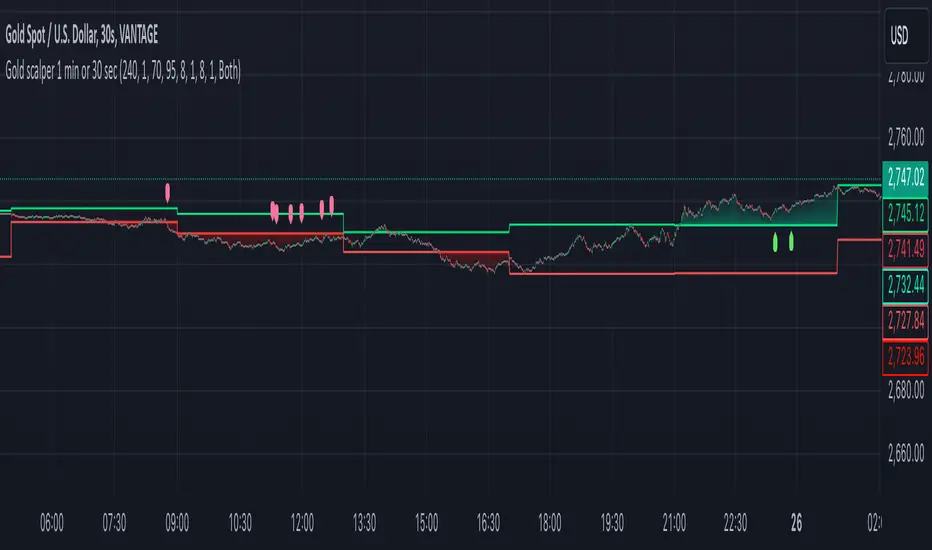
This Pine Script code for TradingView is designed to create a trading indicator titled "Gold scalper 1 min or 30 sec." The indicator is primarily used for scalping gold and is focused on short-term timeframes (1 minute or 30 seconds).
### Key Components of the Code:
1. **Inputs:**
- **Resolution:** Users can set the timeframe for analysis (default is 240 minutes).
- **SMA (Simple Moving Average):** Users can specify the period for the SMA used in the calculations.
2. **Daily Highs and Lows:**
- The script calculates the previous day’s high (`yesterdayHigh`) and low (`yesterdayLow`) prices using the `request.security` function.
3. **SMA Calculation:**
- An SMA is computed based on the closing prices of the selected timeframe.
4. **Breakout Conditions:**
- The script detects breakouts using the SMA in relation to yesterday's high and low:
- A breakout upwards occurs when the SMA crosses above the previous day's high.
- A breakout downwards occurs when the SMA crosses below the previous day's low.
5. **RSI (Relative Strength Index) Calculations:**
- Two RSI values are calculated to assess market momentum:
- **Banker RSI:** Used for buy conditions.
- **Hot Money RSI:** Used for sell conditions.
- These include adjustable sensitivity factors and periods to customize the indicator’s sensitivity.
6. **Trade Direction Selection:**
- Users can select whether to trade long, short, or both directions.
7. **Buy and Sell Signals:**
- Buy conditions are set when the Retail Moving Average crosses the Banker Moving Average under certain conditions.
- Sell conditions are marked when the Banker Moving Average crosses under the specified sell threshold.
- These signals are visually represented on the chart with specific shapes (up arrows for buys and down arrows for sells).
8. **Alerts:**
- Alerts are generated for buy and sell signals to notify users when certain conditions are met.
9. **Trend Visualization:**
- The script visually indicates uptrends and downtrends on the chart by plotting colors based on the relationship between the current price, yesterday's high, and low.
### General Purpose:
This indicator is designed to assist traders in identifying potential buying and selling opportunities in the gold market based on short-term price movements and momentum indicators, helping them capitalize on quick price fluctuations that are characteristic of scalping strategies.
開源腳本
秉持TradingView一貫精神,這個腳本的創作者將其設為開源,以便交易者檢視並驗證其功能。向作者致敬!您可以免費使用此腳本,但請注意,重新發佈代碼需遵守我們的社群規範。
免責聲明
這些資訊和出版物並非旨在提供,也不構成TradingView提供或認可的任何形式的財務、投資、交易或其他類型的建議或推薦。請閱讀使用條款以了解更多資訊。
開源腳本
秉持TradingView一貫精神,這個腳本的創作者將其設為開源,以便交易者檢視並驗證其功能。向作者致敬!您可以免費使用此腳本,但請注意,重新發佈代碼需遵守我們的社群規範。
免責聲明
這些資訊和出版物並非旨在提供,也不構成TradingView提供或認可的任何形式的財務、投資、交易或其他類型的建議或推薦。請閱讀使用條款以了解更多資訊。