INVITE-ONLY SCRIPT
Adam-Cox LTC Realised v1 Invite-Only
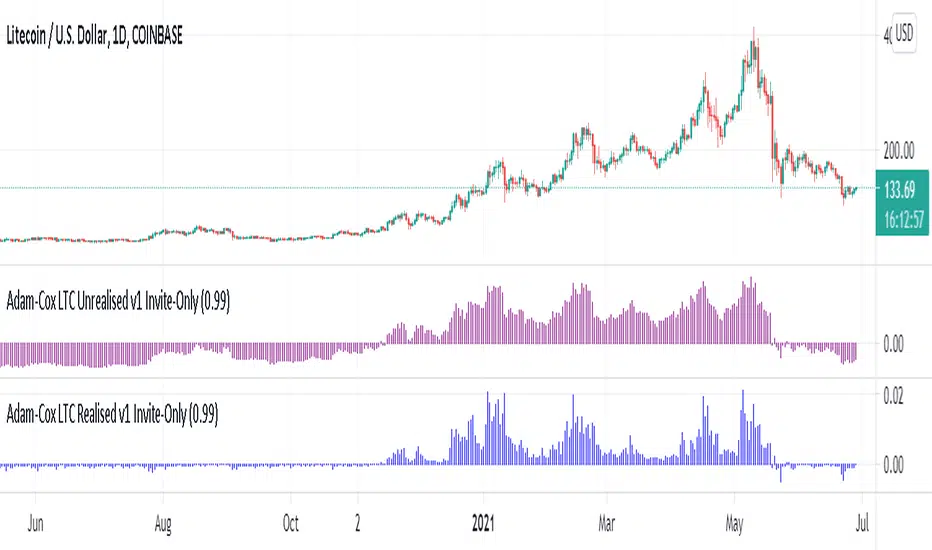
Use on daily LTC charts to understand where potential price action is occurring during peaks of profit and loss taking place on-average in the market. In the same way where large turnover can be used to identify areas of profit taking, or loss realisation (i.e. losing trade close-out) , this study examines this phenomena directly and is similar to indicators published for DOGE and BTC.
僅限邀請腳本
僅限作者授權的用戶訪問此腳本,並且通常需要付費。您可以將其增加到收藏腳本中,但是只有在向作者請求並獲得許可之後,才能使用它。 請聯繫Adam-Cox以了解更多信息,或按照下面作者的說明進行操作。
TradingView 不建議購買並使用此腳本,除非您 100% 信任其作者並了解腳本的工作原理。在許多情況下,您可以在我們的社群腳本中免費找到良好的開源替代方案。
作者的說明
″Use on daily LTC charts to understand where potential price action is occurring during peaks of profit and loss taking place on-average in the market.
想在圖表上使用此腳本?
警告:請閱讀,然後再請求訪問權限。
免責聲明
這些資訊和出版物並不意味著也不構成TradingView提供或認可的金融、投資、交易或其他類型的意見或建議。請在使用條款閱讀更多資訊。