OPEN-SOURCE SCRIPT
已更新 Smart Volume
This script introduces a unique approach to volume analysis by combining three critical components that work together to identify institutional activity:
1. Adaptive Volume Analysis
- Automatically calculates significant volume thresholds specific to each stock (current bar volume compared to the average of previous 6 bars)
- Unlike standard indicators using fixed multipliers (like 2x average volume), this adapts to each stock's unique trading characteristics
- Example: A 2x volume spike might be significant for AAPL but irrelevant for a volatile small-cap
2. Volume Contraction Pattern (VCP) Detection
- Identifies periods of decreasing volume with precise criteria:
• Requires 6+ consecutive periods of declining volume
• Volume must compress by at least 20% from peak
• Price must remain within a defined channel
- Automatically detects completion of compression patterns
3. RVM (Relative Volatility Measure) Integration
- Measures current volatility against historical averages
- Identifies low-volatility periods that often precede major moves
- When combined with volume compression, signals higher probability setups
How Components Work Together:
- Volume spikes are evaluated against stock-specific thresholds
- VCP detection runs continuously to identify compression patterns
- RVM confirms volatility contraction aligned with volume compression
- When all three align, the indicator signals potential breakout entry
Usage:
1. Monitor volume bars for spikes above adaptive thresholds (bright green/red)|
2. Monitor average volume line turning from white to green indicating volume contraction (the brighter the green the more contraction happened)
2. Watch for green shading at the zero-line indicating volatility compression (RVM)
3. Use the statistics table for more insights
Original Features:
- First indicator to combine adaptive volume thresholds with VCP detection
- Implements stock-specific volume analysis instead of fixed multipliers
- Integrates volatility confirmation with volume patterns
- Provides real-time statistical analysis of compression patterns
Best suited for daily timeframes on liquid stocks where institutional activity is most visible.
Note: While patterns suggest potential moves, always confirm with price action before trading.
Video:
發行說明
Smart Volume Analyzer: Pattern-Based Volume AnalysisThis script introduces an original approach to volume analysis by combining three synergistic components:
Adaptive Volume Analysis
Automatically calibrates significant volume thresholds using a dynamic 6-bar moving average
Each stock gets its own custom volume profile rather than using fixed multiples
Applies RVM (Relative Volatility Measure) to validate volume signals, filtering out noise during high volatility periods
Advanced Pattern Recognition
Detects volume climax events (selling/buying) using precise mathematical criteria:
• Volume > 3x normal AND
• Price closes in opposite half of candle AND
• New high/low made with increasing volume
Identifies institutional volume dry-ups when volume drops below 50% of 20-period average with consecutive decreases
Statistical Validation
Real-time calculation of compression ratios and pattern strength
Volume-price divergence detection using 5-period momentum comparisons
Dynamic liquidity scoring based on relative volume and market participation
Practical Applications:
Institutional accumulation detection through combined volume compression + volatility contraction
Early trend reversal identification via climax volume patterns
Risk management through real-time liquidity assessment
Key Differentiators:
Uses HMA-based volume analysis instead of standard moving averages for faster response
Implements true adaptive thresholds rather than fixed multipliers
Combines volume patterns with volatility structure for higher probability setups
Best suited for daily timeframes where institutional footprints are most visible. Works on any liquid instrument with volume data.
發行說明
table customizations added發行說明
gray text on one cell -> white發行說明
Simplified the multiple-bins to 3 options only.發行說明
added ability to show/hide the stats table發行說明
Changes:- Included "volatility expansion" as red markers at the bottom of the panel
- made grayed bars a little bit more visible
發行說明
Streamlined version replacing the table for a "Insights label" at the last bar. Just hover over the label to get insightsIncluded Accumulation / Distribution detection. You can now scan for strong accumulation names using Pine Screener.
發行說明
fixed issue with insights label 發行說明
label->tiny發行說明
✨ What's New in v3?Key Upgrades at a Glance
🧠 Smarter Spike Detection: Introducing the new Adaptive Volume Threshold, which automatically adjusts to current market volatility for more reliable signals.
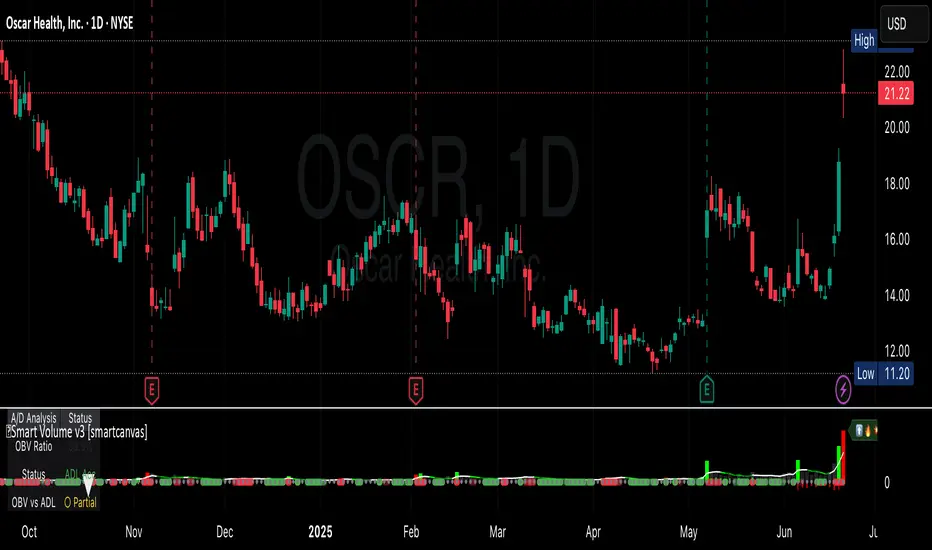
🔍 All-New A/D Engine: The Accumulation/Distribution analysis has been completely revamped with powerful new visualizations.
📊 A/D Info Table: A dedicated table now gives you a clear, at-a-glance summary of buying vs. selling pressure.
🎨 Customizable Visuals: Choose how you want to see A/D data: as a Histogram, a Line, a Background Color, or a combination!
💡 Streamlined UI: The Insights Label is now more compact, using emojis for a quick read, while the settings have been reorganized for easier use.
🛠️ Code Optimization: Significant refactoring under the hood for a faster, more efficient, and stable script.
New Visualizations: In the settings, you can now choose your preferred "Visualization Style" for the A/D data. The new Histogram provides an incredibly intuitive look at the strength of buying or selling pressure on each bar.
New A/D Info Table: For a clean and persistent view, a new table appears in the top-left of the indicator pane. It gives you the current OBV Ratio, the confirmed status (e.g., "Strong Accumulation"), and checks if the OBV and ADL methods are in agreement—crucial for high-conviction trade ideas!
✨ Cleaner & Quicker Insights: Revamped UI
We've decluttered the interface to help you get the information you need, faster.
Compact Insights Label: The on-chart label is now much cleaner, using emojis (⬆️, ⬇️, 🔥, 💥) to summarize the most important conditions at a glance. The full detailed breakdown is still available in the tooltip when you hover over it.
Organized Settings: The input menu has been logically regrouped for a more user-friendly experience.
開源腳本
秉持TradingView一貫精神,這個腳本的創作者將其設為開源,以便交易者檢視並驗證其功能。向作者致敬!您可以免費使用此腳本,但請注意,重新發佈代碼需遵守我們的社群規範。
Cyclist, Trader, Technologist. Get access to data for my options indicators on smartcanvas.com for free via bots
免責聲明
這些資訊和出版物並非旨在提供,也不構成TradingView提供或認可的任何形式的財務、投資、交易或其他類型的建議或推薦。請閱讀使用條款以了解更多資訊。
開源腳本
秉持TradingView一貫精神,這個腳本的創作者將其設為開源,以便交易者檢視並驗證其功能。向作者致敬!您可以免費使用此腳本,但請注意,重新發佈代碼需遵守我們的社群規範。
Cyclist, Trader, Technologist. Get access to data for my options indicators on smartcanvas.com for free via bots
免責聲明
這些資訊和出版物並非旨在提供,也不構成TradingView提供或認可的任何形式的財務、投資、交易或其他類型的建議或推薦。請閱讀使用條款以了解更多資訊。