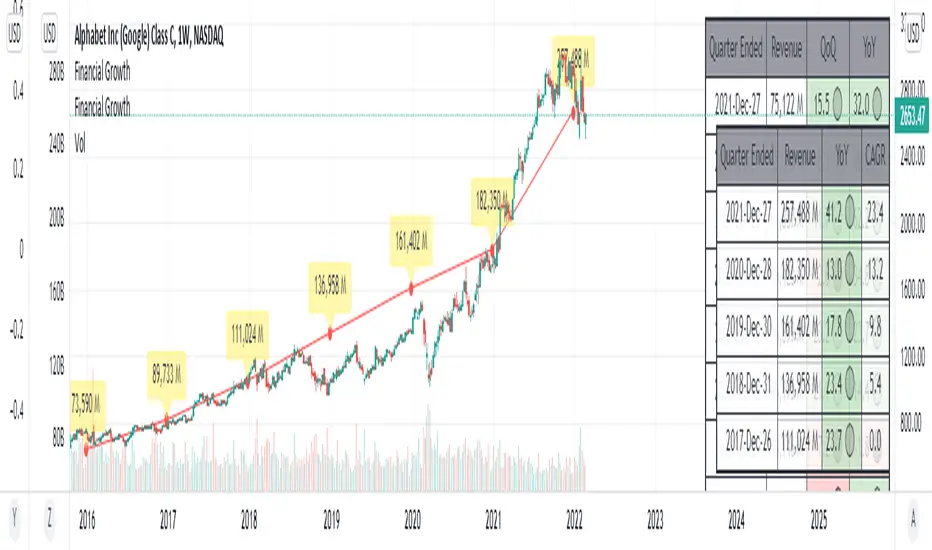
This indicator will acquire the financial data provided by Tradview.
the data is compare between Quarter, Annual and TTM in term of percent of growth.
YoY, QoQ and CAGR is also available by this script (The minimum is 4).
in addition, ploting of data, label and table also available (you can check the mark to toggle on / off).
Data : Revenue, Net Income, EBITDA, EPS, DVPS, Free Cash Flow and Forward PE .
How to use it.
just select the financial data, period and size of data to compare.
you can check the box to toggle the plotting line, label and table.
Enjoy.
發行說明
Fix comparison calculations 發行說明
- More items added. - fixed CAGR.
New Items Added
- Key Financial Number : Revenue, Net Income, EBITDA, EPS, DVPS, Free Cash Flow, Total Debt
- Key Financial Ratio : Gross Margin, EBITDA Margin, Net Margin, ROE, ROA, Price to Book Value (P/BV), Price to Earnings (P/E)
發行說明
Update Detail : 2022-Dec-17- Add 2 financial items.
- Add eps, diluted.
- Re-arrange code.
發行說明
Re-arranged code. Add more items related to debt.
發行說明
there's some problem about version.so i updated again.
開源腳本
秉持TradingView一貫精神,這個腳本的創作者將其設為開源,以便交易者檢視並驗證其功能。向作者致敬!您可以免費使用此腳本,但請注意,重新發佈代碼需遵守我們的社群規範。
免責聲明
這些資訊和出版物並非旨在提供,也不構成TradingView提供或認可的任何形式的財務、投資、交易或其他類型的建議或推薦。請閱讀使用條款以了解更多資訊。
免責聲明
這些資訊和出版物並非旨在提供,也不構成TradingView提供或認可的任何形式的財務、投資、交易或其他類型的建議或推薦。請閱讀使用條款以了解更多資訊。