OPEN-SOURCE SCRIPT
已更新 Horizontal Lines from Current Price
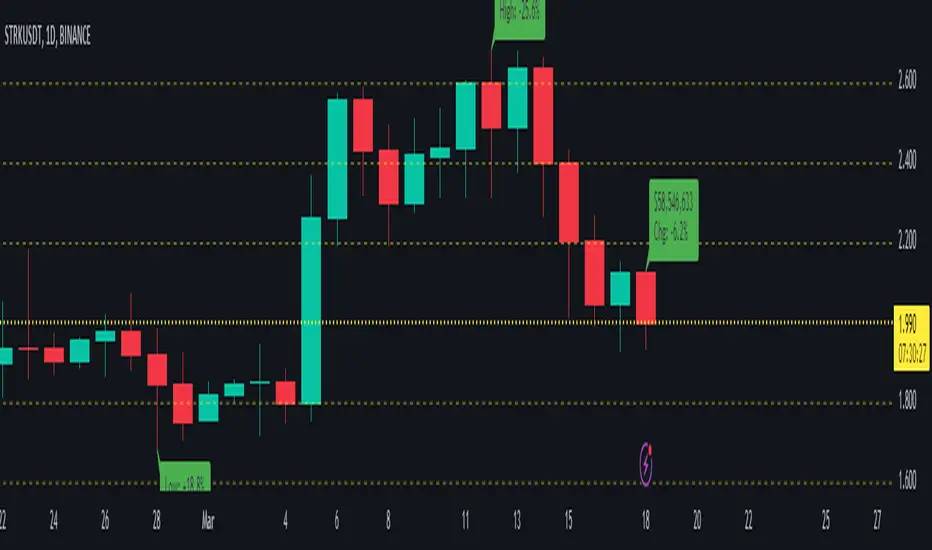
This indicator will help traders track price fluctuations in smaller time frames more conveniently than ever before.
Here's how it works:
Additionally, we also provide volume display (measured in USD) at the current candle position to assist traders in keeping track of market momentum more closely.
Installation guide for indicators:
Here's how it works:
Starting from the current price, the indicator will draw horizontal lines spaced 10% apart.
Now, whenever zooming in or out of the chart, traders can visually determine the level of price volatility more easily.
Additionally, we also provide volume display (measured in USD) at the current candle position to assist traders in keeping track of market momentum more closely.
Installation guide for indicators:
After installing the indicator, make sure that the indicator is merged with the price chart.
Secondly, ensure that the scale bar of the indicator merges with the scale bar of the price chart.
發行說明
Update default inputs發行說明
Clean source code & Inputs發行說明
➕ Added the feature to view the highest and lowest price changes of the current bar compared to the previous bars.⚡⚡⚡發行說明
Clean source code 🚧🚧🚧發行說明
➕ Added the feature to view the changes in the current price bar.⚡⚡⚡發行說明
Clean source code 🚧🚧🚧發行說明
Update display current price 🚧🚧🚧發行說明
Fix bug 🚧🚧🚧發行說明
Fix bug 🚧🚧🚧發行說明
Fix bug 🚧🚧🚧發行說明
Fix bug 🚧🚧🚧發行說明
Fix bug 🚧🚧🚧發行說明
Fix bug 🚧🚧🚧發行說明
Fix bug 🚧🚧🚧開源腳本
秉持TradingView一貫精神,這個腳本的創作者將其設為開源,以便交易者檢視並驗證其功能。向作者致敬!您可以免費使用此腳本,但請注意,重新發佈代碼需遵守我們的社群規範。
免責聲明
這些資訊和出版物並非旨在提供,也不構成TradingView提供或認可的任何形式的財務、投資、交易或其他類型的建議或推薦。請閱讀使用條款以了解更多資訊。
免責聲明
這些資訊和出版物並非旨在提供,也不構成TradingView提供或認可的任何形式的財務、投資、交易或其他類型的建議或推薦。請閱讀使用條款以了解更多資訊。