PROTECTED SOURCE SCRIPT
EMA MAGIC BAND
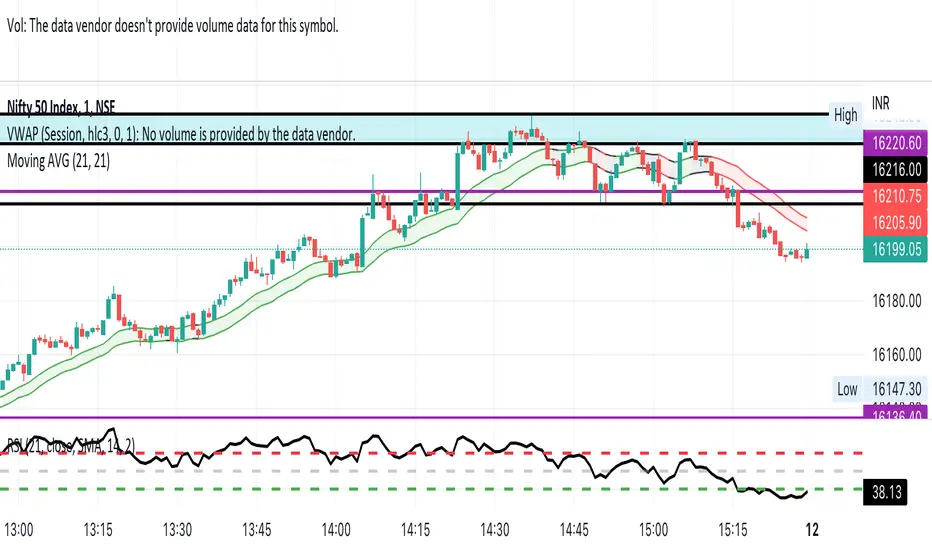
This is the 21 EMA Band Which follows the chart for the last 21 Average High and Low Prices of the Candle with Integrated RSI. This is a Colourful Band When Market is in Uptrend it shows Green, Market is Downtrend it shows Red and When Sideways Black.
受保護腳本
此腳本以閉源形式發佈。 不過,您可以自由使用,沒有任何限制 — 點擊此處了解更多。
免責聲明
這些資訊和出版物並非旨在提供,也不構成TradingView提供或認可的任何形式的財務、投資、交易或其他類型的建議或推薦。請閱讀使用條款以了解更多資訊。
受保護腳本
此腳本以閉源形式發佈。 不過,您可以自由使用,沒有任何限制 — 點擊此處了解更多。
免責聲明
這些資訊和出版物並非旨在提供,也不構成TradingView提供或認可的任何形式的財務、投資、交易或其他類型的建議或推薦。請閱讀使用條款以了解更多資訊。