OPEN-SOURCE SCRIPT
Dynamic 50% Line [Daily and Weekly Range]
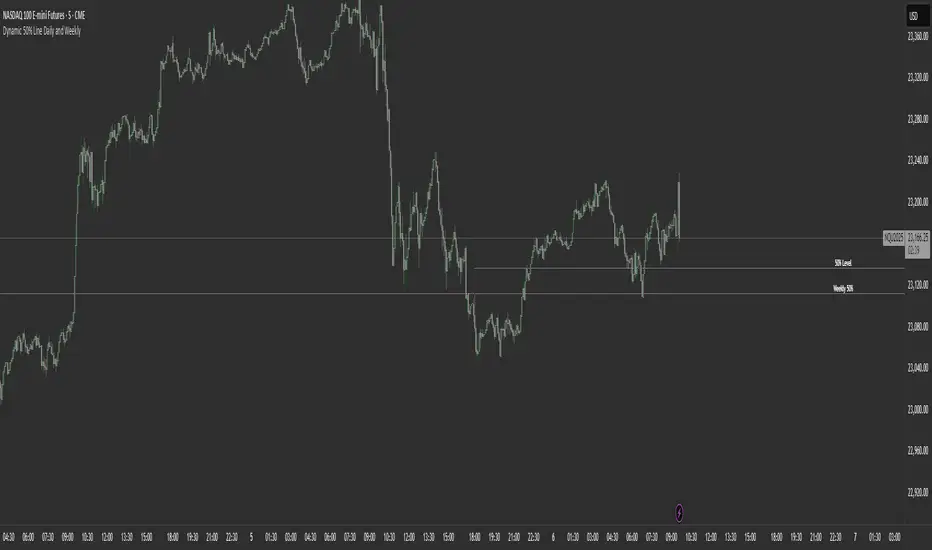
This indicator automatically plots the 50% retracement level (midpoint) of the daily and weekly trading ranges. It helps traders identify key support/resistance zones where price may react, offering insights into potential reversal or continuation areas.
Auction Market Theory & the 50% Level
At its core, this indicator is built on Auction Market Theory (AMT), which views price movement as an ongoing auction process where buyers and sellers compete to establish value. The 50% midpoint represents fair value—the equilibrium where price is most likely to balance before continuing its trend or reversing.
When price deviates too far from this level, it often returns to balance (mean reversion) or accepts new value (breakout). By tracking the daily and weekly 50% lines, traders can:
This makes the indicator particularly powerful for traders who follow volume profile, order flow, or ICT concepts, as it visually maps the market’s ongoing auction process.
Features:
✅ Automated Daily & Weekly Midpoints – Calculates the 50% level from the high/low of each session.
✅ Customizable Line Styles – Choose between solid, dotted, or dashed lines for better visibility.
✅ Clear Labeling – Optional text labels show "50% Level" or custom text at your preferred position (left, middle, or right).
✅ Flexible Styling – Adjust line colors, thickness, and text size to match your chart theme.
How It Works:
Why Use This Indicator?
Unlike static Fibonacci tools, this dynamic indicator auto-updates the 50% level as new highs/lows form, saving time and improving accuracy. Whether you trade forex, stocks, or crypto, these levels often act as strong magnets for price action.
Auction Market Theory & the 50% Level
At its core, this indicator is built on Auction Market Theory (AMT), which views price movement as an ongoing auction process where buyers and sellers compete to establish value. The 50% midpoint represents fair value—the equilibrium where price is most likely to balance before continuing its trend or reversing.
When price deviates too far from this level, it often returns to balance (mean reversion) or accepts new value (breakout). By tracking the daily and weekly 50% lines, traders can:
- Identify high-probability reversal zones (where price may reject fair value).
- Spot trend continuation areas (where price accepts higher/lower value).
- Align with institutional order flow, as large players often use these levels for execution.
This makes the indicator particularly powerful for traders who follow volume profile, order flow, or ICT concepts, as it visually maps the market’s ongoing auction process.
Features:
✅ Automated Daily & Weekly Midpoints – Calculates the 50% level from the high/low of each session.
✅ Customizable Line Styles – Choose between solid, dotted, or dashed lines for better visibility.
✅ Clear Labeling – Optional text labels show "50% Level" or custom text at your preferred position (left, middle, or right).
✅ Flexible Styling – Adjust line colors, thickness, and text size to match your chart theme.
How It Works:
- Daily 50% Line: Resets at 6 PM NY time (new trading day).
- Weekly 50% Line: Resets on Sunday at 6 PM NY time (new trading week).
- The midpoint is calculated as:
- (High + Low) / 2
- Lines extend 500 bars forward for easy visibility.
Why Use This Indicator?
Unlike static Fibonacci tools, this dynamic indicator auto-updates the 50% level as new highs/lows form, saving time and improving accuracy. Whether you trade forex, stocks, or crypto, these levels often act as strong magnets for price action.
開源腳本
秉持TradingView一貫精神,這個腳本的創作者將其設為開源,以便交易者檢視並驗證其功能。向作者致敬!您可以免費使用此腳本,但請注意,重新發佈代碼需遵守我們的社群規範。
免責聲明
這些資訊和出版物並非旨在提供,也不構成TradingView提供或認可的任何形式的財務、投資、交易或其他類型的建議或推薦。請閱讀使用條款以了解更多資訊。
開源腳本
秉持TradingView一貫精神,這個腳本的創作者將其設為開源,以便交易者檢視並驗證其功能。向作者致敬!您可以免費使用此腳本,但請注意,重新發佈代碼需遵守我們的社群規範。
免責聲明
這些資訊和出版物並非旨在提供,也不構成TradingView提供或認可的任何形式的財務、投資、交易或其他類型的建議或推薦。請閱讀使用條款以了解更多資訊。