OPEN-SOURCE SCRIPT
Enhanced Circle Candlestick
Enhanced Circle Candlestick
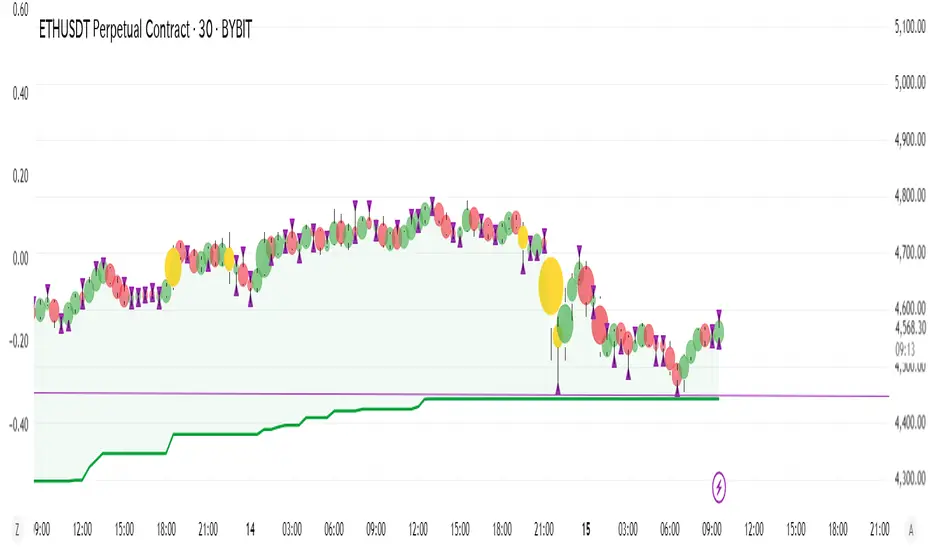
This script transforms standard candlesticks into circles, visualizing momentum, volume, and volatility in a unique way. The size and color of the circles change based on the body size of the candlestick, while a change in color signifies a volume spike. Long wicks are also highlighted, providing a quick visual cue for potential reversals or indecision.
Features
Circle Visualization: Replaces the standard candlestick body with a circle. The size of the circle is determined by the size of the candlestick body, making it easy to spot periods of high momentum.Gradient Color: The circle's opacity changes based on the body size. Smaller bodies have a lighter color, while larger, more powerful bodies have a darker, more vivid color. This visual gradient provides a clear indication of a bar's strength.Volume Spike Highlight: The circle's color will change to a bright yellow when the current volume exceeds the average volume by a user-defined factor, indicating a significant influx of buying or selling pressure.Long Wick Markers: The script draws a small triangle above or below the candlestick when a wick's length surpasses a user-defined percentage of the body's size. This helps identify potential exhaustion, rejection, or indecision in the market.
Settings
Bullish/Bearish Color: Customize the base colors for bullish (green) and bearish (red) circles.Volume Spike Color: Choose the color for the circle when a volume spike occurs.Volume Spike Factor: Set the multiplier for the volume spike detection. For example, a value of 2.0 means a volume spike is detected when the current volume is twice the 20-period moving average.Circle Opacity (0-100): Adjust the base transparency of the circles. Lower numbers result in more opaque (solid) colors.Opacity Factor: Controls how quickly the color gradient changes based on the body size. A higher value makes the color change more dramatic.Wick Length Factor (vs Body): Set the threshold for marking long wicks. A value of 0.8 means a wick is marked if its length is 80% or more of the candlestick body's size.
How to Use
Add this indicator to your chart.Open the Chart Settings.In the "Symbol" tab, set the transparency of the candlestick "Body" to 0%. (This step is essential because the indicator's settings will not be applied when the indicator is not selected, and the default platform settings take precedence.)
[Important Notice]
I do not speak English at all. Please understand that if you send me a message, I may not be able to reply, or my reply may have a different meaning. Thank you for your understanding.
開源腳本
秉持TradingView一貫精神,這個腳本的創作者將其設為開源,以便交易者檢視並驗證其功能。向作者致敬!您可以免費使用此腳本,但請注意,重新發佈代碼需遵守我們的社群規範。
The Leap 1000位以内2回
The Leap Top 1000 Rank (x2), currently Top 1500.
(Mostly luck, though!)
AI Assessment: A Professional Whose Obsession Has Evolved into Instinct
だそーです
The Leap Top 1000 Rank (x2), currently Top 1500.
(Mostly luck, though!)
AI Assessment: A Professional Whose Obsession Has Evolved into Instinct
だそーです
免責聲明
這些資訊和出版物並非旨在提供,也不構成TradingView提供或認可的任何形式的財務、投資、交易或其他類型的建議或推薦。請閱讀使用條款以了解更多資訊。