INVITE-ONLY SCRIPT
The Cloud AI
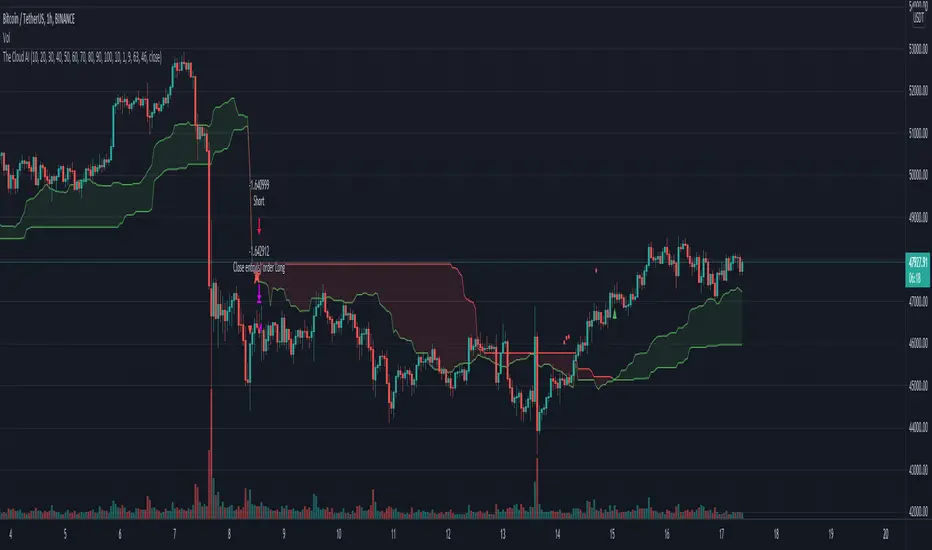
This Script uses the DonChain + EMA and an Average to create a trend cloud.
* When the cloud crosses to red it will print a red triangle mean a potential pullback.
* In a Green cloud green dots are printed after small pullback for scalps or continuation.
* A green or red star is an entry for the strategy which is defined by the all the slow and fast parameters crossing.
Exits will happen when the red or green star is printed.
All these levels help traders see where the price could experience support or resistance, these support and resistance levels can be used by traders to determine entry and exit points.
Using Machine learning I optimised this to work with BTC you can optimise the settings to most markets.
僅限邀請腳本
僅限作者授權的用戶訪問此腳本,並且通常需要付費。您可以將其增加到收藏腳本中,但是只有在向作者請求並獲得許可之後,才能使用它。 請聯繫daviddtech以了解更多信息,或按照下面作者的說明進行操作。
TradingView 不建議購買並使用此腳本,除非您 100% 信任其作者並了解腳本的工作原理。在許多情況下,您可以在我們的社群腳本中免費找到良好的開源替代方案。
作者的說明
″Just send me a DM
想在圖表上使用此腳本?
警告:請閱讀,然後再請求訪問權限。
✅💰⚡ Become part of the community get early get access here:
daviddtech.com
🔥Telegram Group:
t.me/DaviddTech
⚡ Videos & Tutorials :
youtube.com/channel/UC7NJLsf6IonOy8QI8gt5BeA?sub_confirmation=1
♥ @DaviddTech
daviddtech.com
🔥Telegram Group:
t.me/DaviddTech
⚡ Videos & Tutorials :
youtube.com/channel/UC7NJLsf6IonOy8QI8gt5BeA?sub_confirmation=1
♥ @DaviddTech
免責聲明
這些資訊和出版物並不意味著也不構成TradingView提供或認可的金融、投資、交易或其他類型的意見或建議。請在使用條款閱讀更多資訊。