INVITE-ONLY SCRIPT
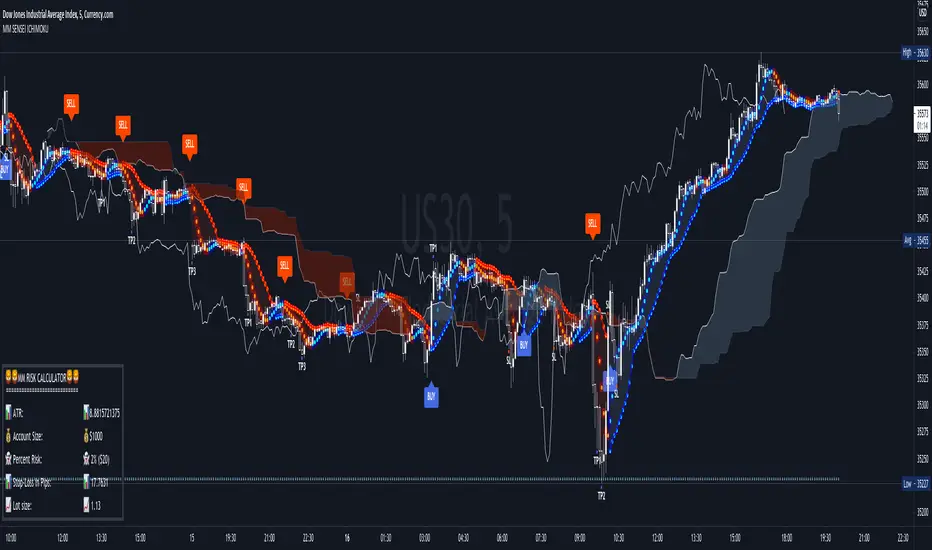
MM SENSEI ICHIMOKU

It was developed in the late 1930s by Goichi Hosoda (細田悟一, Hosoda Goichi), a Japanese journalist who used to be known as Ichimoku Sanjin (一目山人, Ichimoku Sanjin), which can be translated as "what a man in the mountain sees". He spent 30 years perfecting the technique before releasing his findings to the general public in the late 1960s.
Ichimoku Kinko Hyo translates to one glance equilibrium chart or instant look at the balance chart and is sometimes referred to as "one glance cloud chart" based on the unique "clouds" that feature in Ichimoku charting.
Ichimoku is a moving average-based trend identification system and because it contains more data points than standard candlestick charts, it provides a clearer picture of potential price action. The main difference between how moving averages are plotted in Ichimoku as opposed to other methods is that Ichimoku's lines are constructed using the 50% point of the highs and lows as opposed to the candle's closing price. Ichimoku takes into consideration the factor of time as an additional element along with the price action, similar to William Delbert Gann's trading ideas.
Here is What I Added
'Select between 5 different buy conditions
.auto Atr risk management
.auto pivot levels based on timeframe
.alerts send full signals to your phone
.added trading sessions
.Mtf cloud filter at bottom of the screen
"strict" feature that only shows trades with the trend
How to use
There are many ways to use this Algo based on the different signals it provides
you use the auto pivots for swing trading
or use the cross over signals to scalp or intraday trade
the main purpose of this algo was to make sense of the Ichi Cloud and show its genius
Link below or PM us for access to this indicator Happy Trading
僅限邀請腳本
只有經作者批准的使用者才能訪問此腳本。您需要申請並獲得使用權限。該權限通常在付款後授予。如欲了解更多詳情,請依照以下作者的說明操作,或直接聯絡MoneyMovesInvestments。
除非您完全信任其作者並了解腳本的工作原理,否則TradingView不建議您付費或使用腳本。您也可以在我們的社群腳本中找到免費的開源替代方案。
作者的說明
Contact me on
Instagram: @dallionking
website: https://www.moneymovesinvestments.com/
youtube: https://www.youtube.com/moneymovesinvestments
FREE Discord CHAT -https://discord.gg/NqCm58qpR6
免責聲明
這些資訊和出版物並不意味著也不構成TradingView提供或認可的金融、投資、交易或其他類型的意見或建議。請在使用條款閱讀更多資訊。