OPEN-SOURCE SCRIPT
已更新 Mushir's Inside Candle Indicator
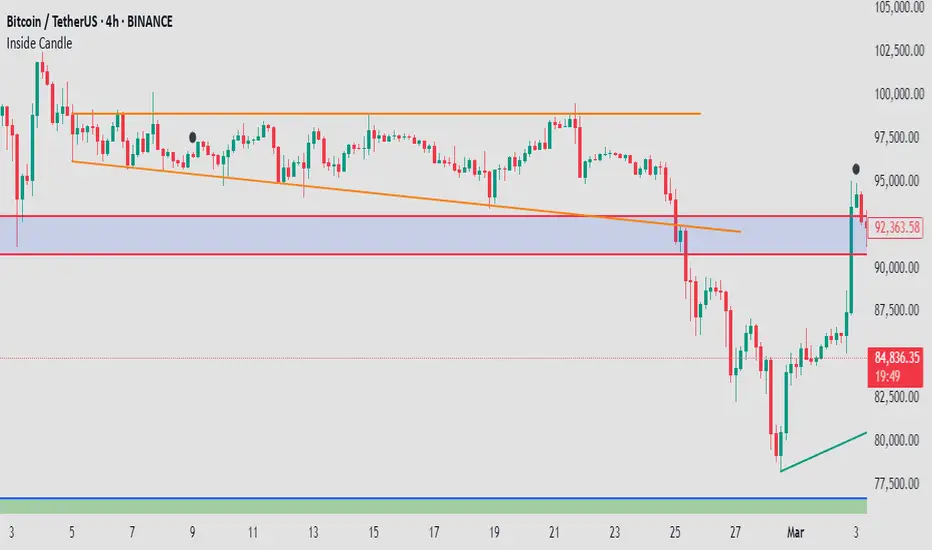
This indicator detects inside candle formations on the chart’s current timeframe. It highlights when a candle’s range is fully engulfed by the previous candle’s range, provided the previous candle meets specific criteria.
How It Works ?
It shows the formation of inside candle on the charts to help in find trades.[NFA]
Mother Candle Validation
The previous candle must be a “leg candle” with a strong body and minimal wicks relative to its body size, ensuring a robust structure.
Inside Candle Detection
The current candle qualifies as an inside candle if:
Its high is ≤ the previous candle’s high.
Its low is ≥ the previous candle’s low.
Why Use This Indicator?
Adapts to the chart’s current timeframe—no manual adjustments needed.
Easily gives you the identification of inside candles
Minimalistic Design
Better results in trending market
How to use it?
- when the inside candle is formed there are certain conditions:
1. if the next candle first crosses the high of inside candle, look for a potential buy trade with RR as 2:1 while stoploss being just below the low of inside candle.
2. if the next candle first crosses the low of inside candle, look for a potential sell trade with RR as 2:1 while stoploss being just above the high of inside candle.
3. if 2:1 is achieved, then increase the partial target to 3:1 while bringing the stoploss to the entry point.
4. if the high is crossed first and then the low is crossed or vice versa then the trade is invalidated.
Happy Trading!
[NFA]
發行說明
Now you can track every inside candle that is formed on the charts (no restrictions of candle body or wick)開源腳本
秉持TradingView一貫精神,這個腳本的創作者將其設為開源,以便交易者檢視並驗證其功能。向作者致敬!您可以免費使用此腳本,但請注意,重新發佈代碼需遵守我們的社群規範。
免責聲明
這些資訊和出版物並非旨在提供,也不構成TradingView提供或認可的任何形式的財務、投資、交易或其他類型的建議或推薦。請閱讀使用條款以了解更多資訊。
開源腳本
秉持TradingView一貫精神,這個腳本的創作者將其設為開源,以便交易者檢視並驗證其功能。向作者致敬!您可以免費使用此腳本,但請注意,重新發佈代碼需遵守我們的社群規範。
免責聲明
這些資訊和出版物並非旨在提供,也不構成TradingView提供或認可的任何形式的財務、投資、交易或其他類型的建議或推薦。請閱讀使用條款以了解更多資訊。