OPEN-SOURCE SCRIPT
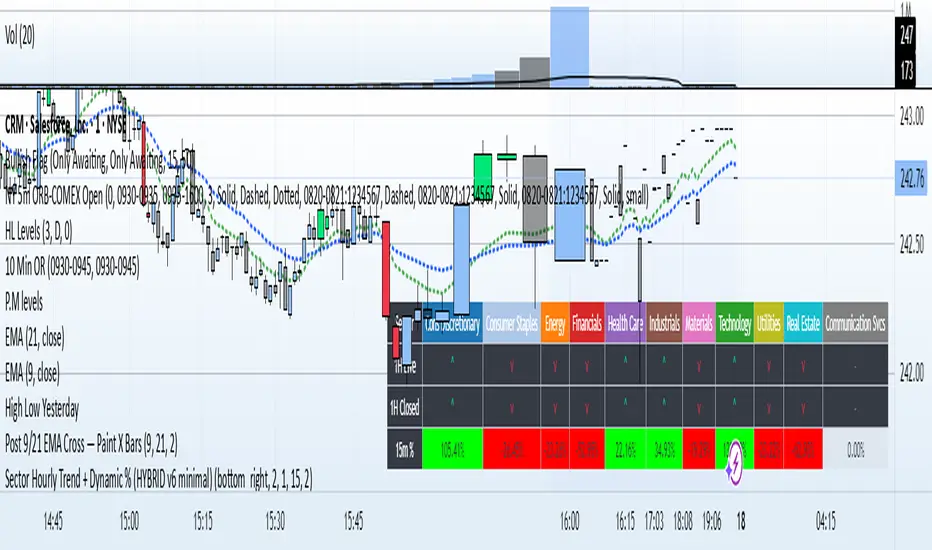
已更新 Sector Hourly Trend + Dynamic %

Here’s a concise but clear description you can give to other users:
---
**📊 Sector Hourly Trend + Dynamic % Change Table (Pine Script v6)**
This TradingView indicator displays a fixed on-screen table showing the **real-time performance** of the 11 major SPDR sector ETFs.
**Features:**
* **Hourly Trend Column:** Uses 60-minute candle data to detect the sector’s current direction vs. the previous hour:
* **^** (green) → sector is up over the past hour.
* **v** (red) → sector is down over the past hour.
* **–** (gray) → no change.
* **Dynamic % Change Column:** Calculates the percentage move over a user-defined window (in minutes) using 1-minute data.
* Background colors: bright green for positive, bright red for negative, gray for no change.
* Text color: black for maximum contrast.
* **Sector Column:** Lists each SPDR sector by name, color-coded for easy identification.
* **Customizable Position:** Choose screen corner and fine-tune with X/Y offsets to avoid overlapping the TradingView Pro badge or UI buttons.
* **Always On-Screen:** The table is fixed to the chart’s viewport, so it stays visible regardless of zoom or scroll.
**Use Cases:**
* Quick visual snapshot of which sectors are leading or lagging intraday.
* Monitor short-term sector rotation without switching tickers.
* Combine with your trading strategy to align trades with sector momentum.
發行說明
I have updated the script so that the user can see the trend of the last 1 hour close in each sector as well as the trend of the current hour.開源腳本
本著TradingView的真正精神,此腳本的創建者將其開源,以便交易者可以查看和驗證其功能。向作者致敬!雖然您可以免費使用它,但請記住,重新發佈程式碼必須遵守我們的網站規則。
免責聲明
這些資訊和出版物並不意味著也不構成TradingView提供或認可的金融、投資、交易或其他類型的意見或建議。請在使用條款閱讀更多資訊。
開源腳本
本著TradingView的真正精神,此腳本的創建者將其開源,以便交易者可以查看和驗證其功能。向作者致敬!雖然您可以免費使用它,但請記住,重新發佈程式碼必須遵守我們的網站規則。
免責聲明
這些資訊和出版物並不意味著也不構成TradingView提供或認可的金融、投資、交易或其他類型的意見或建議。請在使用條款閱讀更多資訊。