INVITE-ONLY SCRIPT
Breakout Hunter [ZuperView]
Based on 2 concepts from Wyckoff Theory, accumulation and distribution zones may reflect the balance of power between buyers and sellers:
Most traders wait for major accumulation/distribution phases, but it takes days or weeks to form. Breakout Hunter lets you take advantage of micro phases – smaller, quicker setups ideal for scalping or intraday trades.
It is a highly customizable indicator that helps you visualize where the market builds up energy. Whether price breaks in line with or against the prior move, it adapts, helping you trade both continuations and reversals.
📌 Key features
Breakout Hunter provides 2 modes for you to choose from:
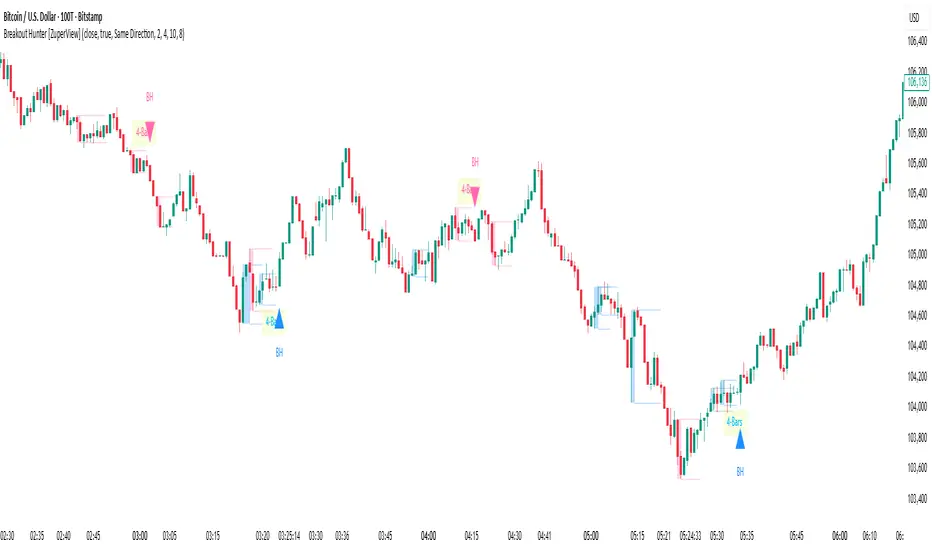
🔸 Same Direction Mode (For successful breakouts)
With this mode, Breakout Hunter will look for and signal breakouts after a successful Distribution/Accumulation phase.

Bullish setup:
1. Breakout Hunter identifies n consecutive bullish candles.

2. Then, it determines the range using the highest high and the lowest low of these candles. This forms a short-term accumulation zone.

3. When price breaks above this range, a bullish signal is triggered.

Bearish setup:
1. Breakout Hunter identifies n consecutive bearish candles.

2. Then, it determines the range using the highest high and the lowest low of these candles. This forms a short-term distribution zone.

3. When the price breaks below this range, a bearish signal is triggered.

🔸 Any Direction Mode (For both successful and failed breakouts)
This mode allows you to get both successful and failed breakouts. So, you can capture entry signals in either direction after an accumulation/distribution phase.
Here is how this mode works:

1. The indicator identifies n consecutive candles followed by a short consolidation phase.
2. If price breaks beyond the range in any direction, a breakout signal is triggered:
Here’s an example of a successful breakout:
After a period of accumulation, price broke out to the upside – the same direction as the phase – indicating a successful breakout, and the indicator triggered a buy signal.

Another example for a failed breakout:
Price attempted to break above the accumulation range but quickly reversed, and the indicator triggered a sell signal.

This mode is ideal for traders who want to capture continuations and reversals alike.
📌 Customization
🔸 Mode: There are 2 modes:
🔸 Period: Number of consecutive bullish/bearish candles.
For example:


🔸 Qualifying Age (Bars): Minimum bars required for a valid range.
This defines how many candles are needed within the Accumulation/Distribution range for it to be considered valid.

🔸 Min High (Ticks): Minimum height (in ticks) for a series of bullish or bearish candles to be recognized as a price increase/decrease.
For example:

🔸 Signal Split Bars: This setting sets the minimum spacing between 2 signals in the same direction (reduces noise).
- Accumulation → buyers absorb supply, preparing for a rally.
- Distribution → sellers absorb demand, preparing for a decline.
Most traders wait for major accumulation/distribution phases, but it takes days or weeks to form. Breakout Hunter lets you take advantage of micro phases – smaller, quicker setups ideal for scalping or intraday trades.
It is a highly customizable indicator that helps you visualize where the market builds up energy. Whether price breaks in line with or against the prior move, it adapts, helping you trade both continuations and reversals.
📌 Key features
Breakout Hunter provides 2 modes for you to choose from:
🔸 Same Direction Mode (For successful breakouts)
With this mode, Breakout Hunter will look for and signal breakouts after a successful Distribution/Accumulation phase.
Bullish setup:
1. Breakout Hunter identifies n consecutive bullish candles.
2. Then, it determines the range using the highest high and the lowest low of these candles. This forms a short-term accumulation zone.
3. When price breaks above this range, a bullish signal is triggered.
Bearish setup:
1. Breakout Hunter identifies n consecutive bearish candles.
2. Then, it determines the range using the highest high and the lowest low of these candles. This forms a short-term distribution zone.
3. When the price breaks below this range, a bearish signal is triggered.
🔸 Any Direction Mode (For both successful and failed breakouts)
This mode allows you to get both successful and failed breakouts. So, you can capture entry signals in either direction after an accumulation/distribution phase.
Here is how this mode works:
1. The indicator identifies n consecutive candles followed by a short consolidation phase.
2. If price breaks beyond the range in any direction, a breakout signal is triggered:
- Breaks in the same direction → indicates a successful breakout.
- Breaks in the opposite direction → indicates a failed breakout or potential reversal.
Here’s an example of a successful breakout:
After a period of accumulation, price broke out to the upside – the same direction as the phase – indicating a successful breakout, and the indicator triggered a buy signal.
Another example for a failed breakout:
Price attempted to break above the accumulation range but quickly reversed, and the indicator triggered a sell signal.
This mode is ideal for traders who want to capture continuations and reversals alike.
📌 Customization
🔸 Mode: There are 2 modes:
- Same Direction Mode: Identify and signal breakout opportunities that align with the prevailing trend following a confirmed accumulation or distribution phase.
- Any Direction Mode: Detects both successful and failed breakout attempts after price consolidates in an accumulation or distribution range.
🔸 Period: Number of consecutive bullish/bearish candles.
For example:
- If you set the period to 5, the indicator will need to identify 5 consecutive bullish or bearish candles to form the range for Accumulation/Distribution.
- If you want to trade shorter-term and receive more signals, you can lower this value.
🔸 Qualifying Age (Bars): Minimum bars required for a valid range.
This defines how many candles are needed within the Accumulation/Distribution range for it to be considered valid.
🔸 Min High (Ticks): Minimum height (in ticks) for a series of bullish or bearish candles to be recognized as a price increase/decrease.
For example:
- If you set it to 10, the series must have a height of at least 10 ticks.
- If you want to receive more signals, values between 10 and 30 are recommended.
🔸 Signal Split Bars: This setting sets the minimum spacing between 2 signals in the same direction (reduces noise).
僅限邀請腳本
只有經作者批准的使用者才能訪問此腳本。您需要申請並獲得使用權限。該權限通常在付款後授予。如欲了解更多詳情,請依照以下作者的說明操作,或直接聯絡ZuperView。
除非您完全信任其作者並了解腳本的工作原理,否則TradingView不建議您付費或使用腳本。您也可以在我們的社群腳本中找到免費的開源替代方案。
作者的說明
To add the indicator to your chart, click "Indicators" → "Invite-only" → find and select the indicator to add it to the chart.
👉 Explore all indicators & systems: zuperview.com/
👉 Join our Discord: discord.gg/YKE6ujrw59
All content provided by ZuperView is for informational & educational purposes only. Past performance does not guarantee future results.
👉 Join our Discord: discord.gg/YKE6ujrw59
All content provided by ZuperView is for informational & educational purposes only. Past performance does not guarantee future results.
免責聲明
這些資訊和出版物並不意味著也不構成TradingView提供或認可的金融、投資、交易或其他類型的意見或建議。請在使用條款閱讀更多資訊。