OPEN-SOURCE SCRIPT
已更新 Longable/Shortable

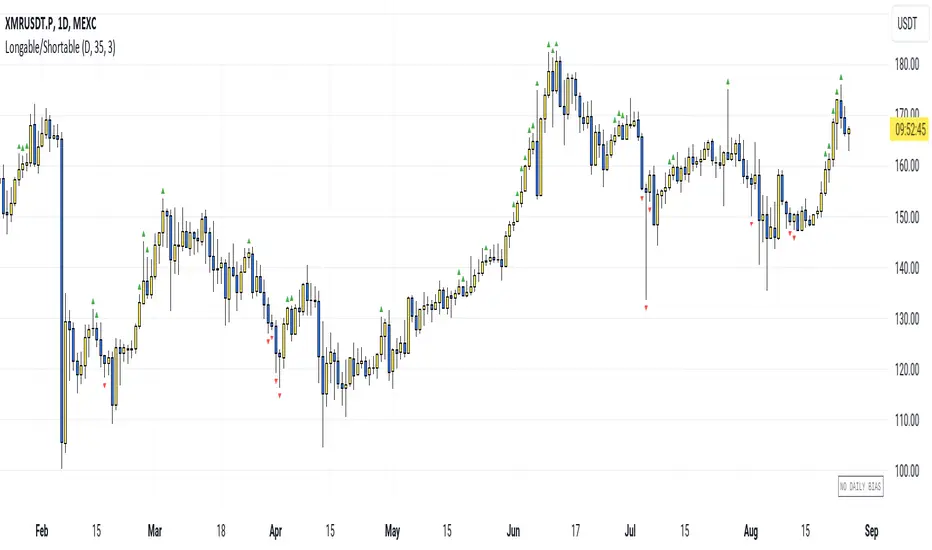
This indicator advises intraday traders which direction NOT to take trades in, based on recent action in the daily chart. Works on any timeframe.
This is not a buy/sell indicator - it is a FILTER that is meant to SUPPRESS trades you may have wanted to take. Like a Daily Bias, but with a neutral position (no bias).
The indicator shows when NOT to take longs and when NOT to take shorts.
So you need an existing strategy to combine this with.
By default, the last 3 days are taken into account (smoothing=3). Change the threshold to get fewer or more warning signals.
The symbols are very simple:
(Each signal is valid for the next candle. After that it expires.)
The current bias is also shown in the bottom right corner.
How it works: We look at which parts of the last candle overlap with the current one. When the new candle's low is far above the last candle's low, it is an indication not to go short. Similarly, when the new candle's high is far below the last candle's high, it is an indication not to go long.
For each direction, we calculate this as a percentage value (what percentage of the last candle is not overlapping the new one), smooth the value and give a signal when we are above the set threshold.
This is not a buy/sell indicator - it is a FILTER that is meant to SUPPRESS trades you may have wanted to take. Like a Daily Bias, but with a neutral position (no bias).
The indicator shows when NOT to take longs and when NOT to take shorts.
So you need an existing strategy to combine this with.
By default, the last 3 days are taken into account (smoothing=3). Change the threshold to get fewer or more warning signals.
The symbols are very simple:
- Green triangle = Longs only
- Red triangle = Shorts only
(Each signal is valid for the next candle. After that it expires.)
The current bias is also shown in the bottom right corner.
How it works: We look at which parts of the last candle overlap with the current one. When the new candle's low is far above the last candle's low, it is an indication not to go short. Similarly, when the new candle's high is far below the last candle's high, it is an indication not to go long.
For each direction, we calculate this as a percentage value (what percentage of the last candle is not overlapping the new one), smooth the value and give a signal when we are above the set threshold.
發行說明
Minimal fix發行說明
You can now disable the triangles in the Style tab if you only want to see the current bias.發行說明
- Fixed the realtime label to reflect the last confirmed candle (not the current candle).
- Improved the value display in status line/data window to show the exact "longability" and "shortabilty" scores (positive = direction is tradeable, negative = direction is not tradeable).
發行說明
Hiding triangle for non-confirmed candle (clearer that way)發行說明
Showing the unconfirmed values in the status line so you can anticipate what the signal for the next candle may be.發行說明
Minor fix for status line values發行說明
Reversed the meaning of the threshold value. Thus, the default value has also changed (from 65 to 35).This has 2 advantages:
- The maximum value of the "longable" and "shortable" scores displayed next to the indicator is now identical to the threshold value.
- The parameter is now much easier to explain: Threshold 35 means that 35% of the top and bottom of each candle must be revisited by the next candle - otherwise a warning signal is generated.
開源腳本
秉持TradingView一貫精神,這個腳本的創作者將其設為開源,以便交易者檢視並驗證其功能。向作者致敬!您可以免費使用此腳本,但請注意,重新發佈代碼需遵守我們的社群規範。
免責聲明
這些資訊和出版物並非旨在提供,也不構成TradingView提供或認可的任何形式的財務、投資、交易或其他類型的建議或推薦。請閱讀使用條款以了解更多資訊。
開源腳本
秉持TradingView一貫精神,這個腳本的創作者將其設為開源,以便交易者檢視並驗證其功能。向作者致敬!您可以免費使用此腳本,但請注意,重新發佈代碼需遵守我們的社群規範。
免責聲明
這些資訊和出版物並非旨在提供,也不構成TradingView提供或認可的任何形式的財務、投資、交易或其他類型的建議或推薦。請閱讀使用條款以了解更多資訊。