OPEN-SOURCE SCRIPT
Sideways Market Detector with High/Low NJR
Calculate the range as the difference between the high and low prices.
The maxRange input to specify the maximum allowable range that defines a sideways market.
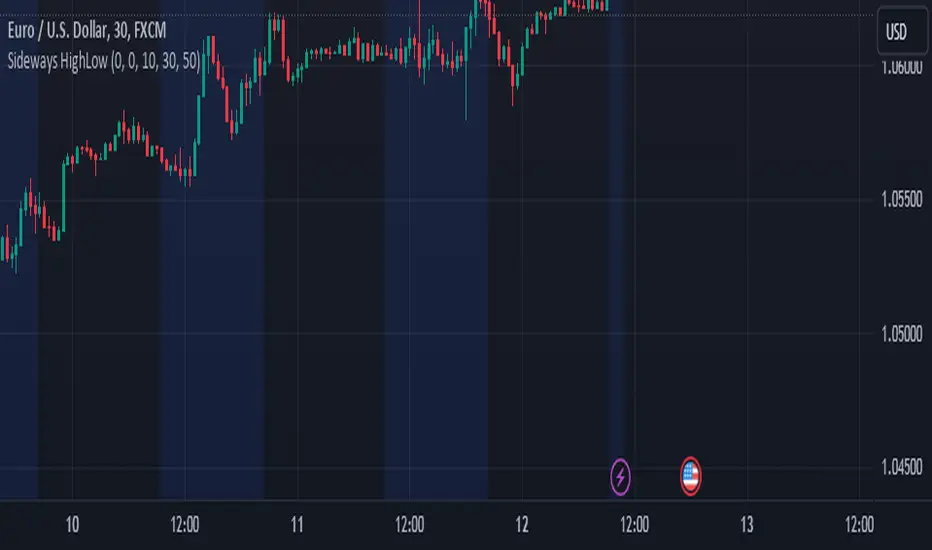
The background color is set to blue during sideways market conditions, and it's transparent to some extent (transp=90). When the market is not sideways, the background color is not changed.
The indicator marks the start and end of the session with red triangles.
When the price range (high - low) is within the specified threshold, the indicator will indicate a sideways market with a blue background.
The maxRange input to specify the maximum allowable range that defines a sideways market.
The background color is set to blue during sideways market conditions, and it's transparent to some extent (transp=90). When the market is not sideways, the background color is not changed.
The indicator marks the start and end of the session with red triangles.
When the price range (high - low) is within the specified threshold, the indicator will indicate a sideways market with a blue background.
開源腳本
秉持TradingView一貫精神,這個腳本的創作者將其設為開源,以便交易者檢視並驗證其功能。向作者致敬!您可以免費使用此腳本,但請注意,重新發佈代碼需遵守我們的社群規範。
免責聲明
這些資訊和出版物並非旨在提供,也不構成TradingView提供或認可的任何形式的財務、投資、交易或其他類型的建議或推薦。請閱讀使用條款以了解更多資訊。
免責聲明
這些資訊和出版物並非旨在提供,也不構成TradingView提供或認可的任何形式的財務、投資、交易或其他類型的建議或推薦。請閱讀使用條款以了解更多資訊。