OPEN-SOURCE SCRIPT
Volume Volatality Indicator
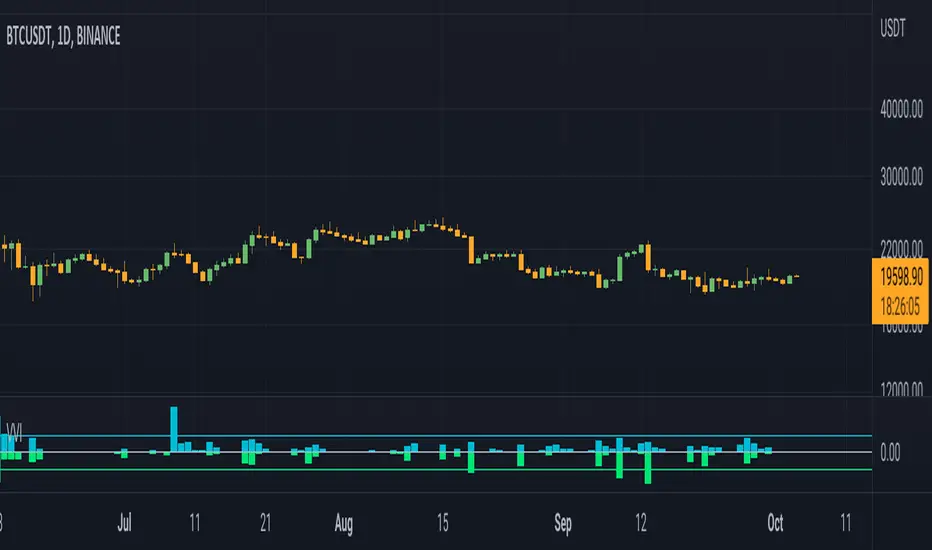
Volume Volatility Indicator
vol: volume; vma: rma of volume
Cyan column shows (vol - vma)/vma, if vol > vma else shows 0
0 value means vol less than vma: good for continuation
0 < value < 1 means vol more than vma: good for trend
value > 1 means vol more than 2 * vma: good for reversal
tr: truerange; atr: averagetruerange
Lime column show -(tr - atr)/atr, if tr > atr else show 0
0 value means tr less than atr: good for continuation
0 > value > -1 means tr more than atr: good for trend
value < -1 means tr more than 2 * atr: good for reversal
Cyan line = 1
Lime line = -1
This indicator shows the volume and truerange together.
Good for filtering trending and consolidating markets.
Thanks for the support.
開源腳本
秉持TradingView一貫精神,這個腳本的創作者將其設為開源,以便交易者檢視並驗證其功能。向作者致敬!您可以免費使用此腳本,但請注意,重新發佈代碼需遵守我們的社群規範。
免責聲明
這些資訊和出版物並非旨在提供,也不構成TradingView提供或認可的任何形式的財務、投資、交易或其他類型的建議或推薦。請閱讀使用條款以了解更多資訊。
開源腳本
秉持TradingView一貫精神,這個腳本的創作者將其設為開源,以便交易者檢視並驗證其功能。向作者致敬!您可以免費使用此腳本,但請注意,重新發佈代碼需遵守我們的社群規範。
免責聲明
這些資訊和出版物並非旨在提供,也不構成TradingView提供或認可的任何形式的財務、投資、交易或其他類型的建議或推薦。請閱讀使用條款以了解更多資訊。